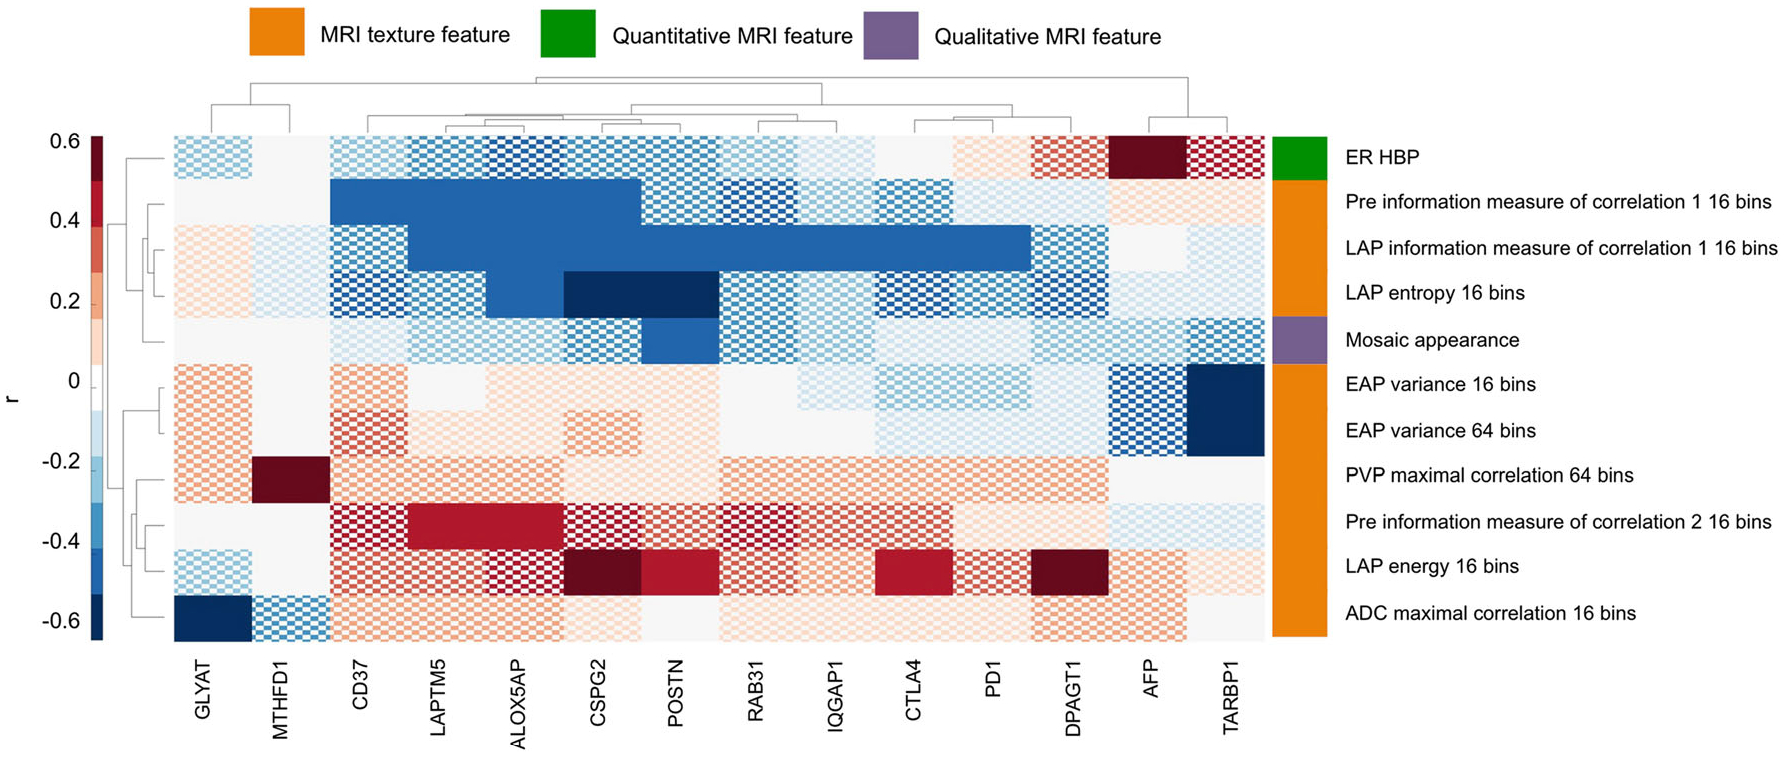
Fig. 3.

Clustergram of significant correlations, expressed as the Spearman correlation coefficient r, between radiomics features and gene expression levels. Only radiomics features and genes for which a significant association (FDR-adjusted p < 0.05) was observed are shown. Correlations are coloured according to the colour bar shown on the left. Nonsignificant correlations are displayed with a checkerboard pattern. Radiomics features, in particular texture features, showed significant association with gene expression levels of HCC markers and therapeutic targets. ADC = apparent diffusion coefficient, EAP = early arterial phase, ER = enhancement ratio, HBP = hepatobiliary phase, LAP = late arterial phase, PVP = portal venous phase
