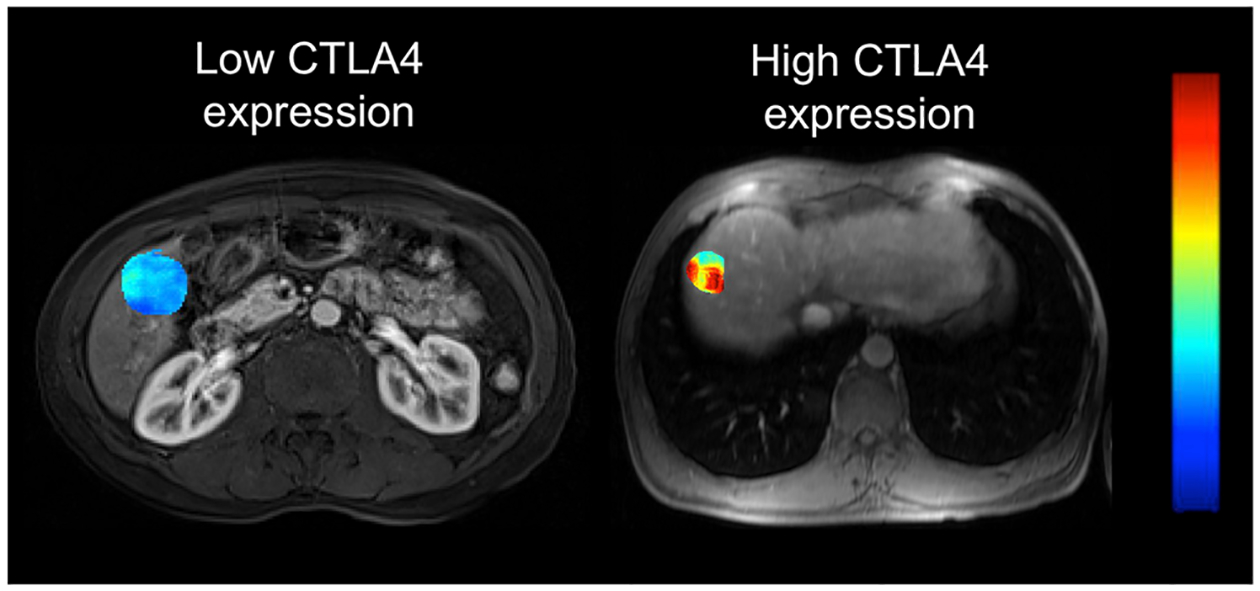
Fig. 4.

Energy texture maps overlaid on T1-weighted post-contrast image obtained during the late arterial phase image. Left: 59-year-old male HBV patient with a 3.7-cm HCC lesion in right hepatic lobe. Energy texture map overlaid on T1-weighted post-contrast image obtained during the late arterial phase image. Texture feature Energy with 16 bins was 0.025 in the lesion, with corresponding molecular expression of immunotherapy target CTLA4 of 0.44. Right: 51-year-old male HBV patient with a 3.3-cm HCC lesion in right hepatic lobe. Texture feature energy with 16 bins was 0.061 in the lesion, with corresponding molecular expression of immunotherapy target CTLA4 of 0.68. The texture feature maps are coloured according to the scale bar on the right with a range of [0–0.1]
