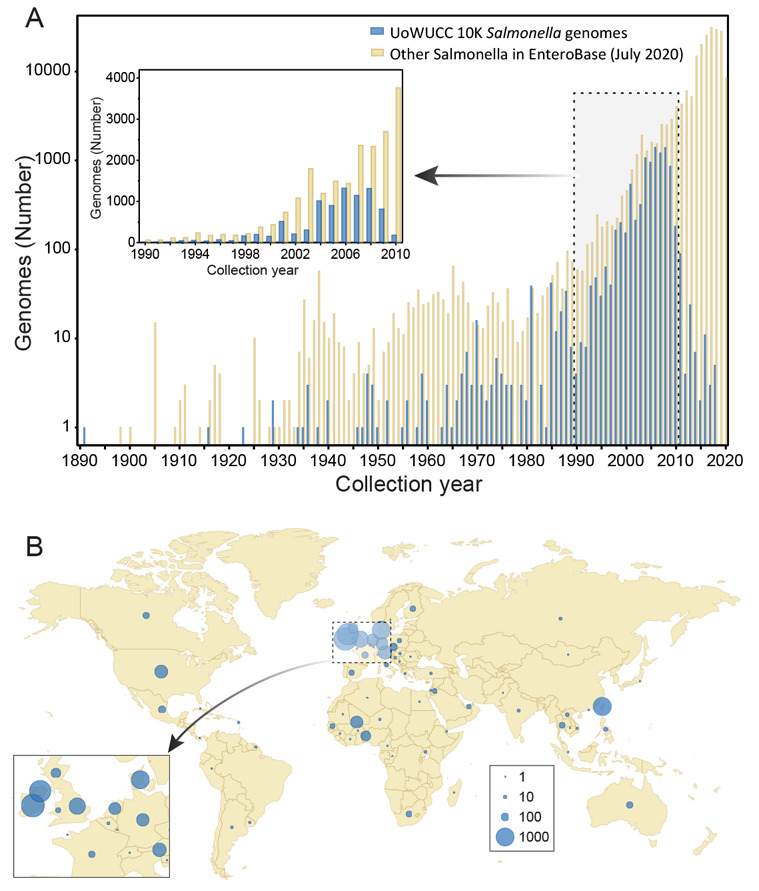
Figure 1. Sources of bacterial isolates for the 10K UoWUCC Salmonella Genomes Project.

A) Semi-logarithmic histogram of numbers of genomes in EnteroBase by year of isolation. Genomes from the 10K project with known dates of isolation are shown in blue and other Salmonella genomes in yellow. Inset: Genomes which were isolated between 1990 and 2010. B) Geographic distribution of sources of isolation. Dot circles are proportional to numbers of strains as indicated in the Key legend at the lower right. Inset: Expanded map of the region near the English Channel.
