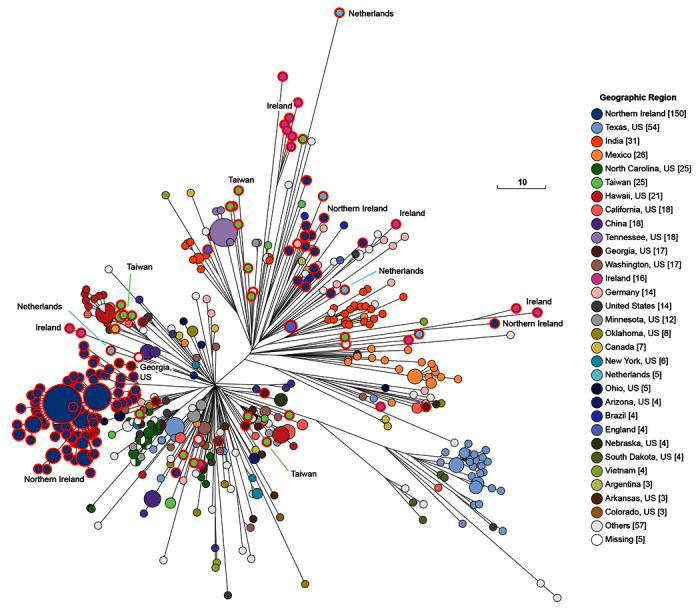
Figure 5. Genomic diversity of 601 pre-2011 genomes from HC100_4 of which 208 were from the 10K genomes project (red perimeters).

The figure shows a Ninja NJ ( Wheeler, 2009) tree of the numbers of different alleles between cgSTs as generated within EnteroBase using GrapeTree ( Zhou et al., 2018a). The geographical sources of some of the isolates from the 10K genomes project are indicated to demonstrate that multiple micro-clades were present in individual countries. An interactive version can be found at http://enterobase.warwick.ac.uk/a/46139, in which the user can use other metadata for coloring genomes. The same tree colored by general source can be found in Figure 6 and a tree showing all modern Mbandaka and Lubbock genomes can be found in Figure 7. Scale bar: 10 alleles. Color Key at right.
