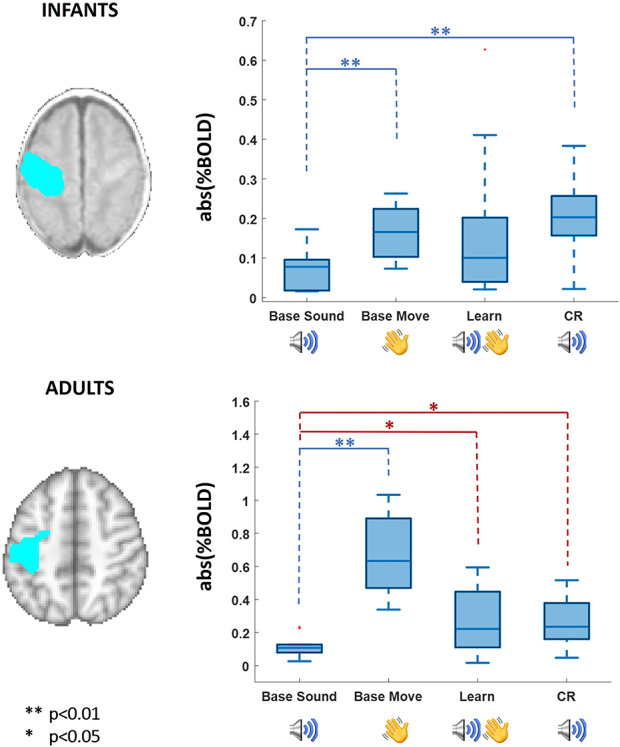
Figure 3.

Measure of BOLD percentage signal change in SM1 calculated within a mask (blue) derived from the response to the passive movement baseline response. The absolute value of the percent signal change was calculated for the sound and movement prelearning (Base, n = 11, n = 13), and learning blocks (Learn, n = 13) and sound alone (CR, n = 13). On the top box-plot, infants’ data show a significant difference of response between the sound prelearning and both prelearning hand movement and sound alone during learning. On the bottom box-plot, adult data show a significant difference between the amplitude of BOLD responses within the SM1 mask in the baseline sound and prelearning hand movement (blue, Friedman test applied to all conditions), and baseline sound to both learning conditions (paired stimuli and CR) (red, Wilcoxon signed rank test).
