
Figure 1.
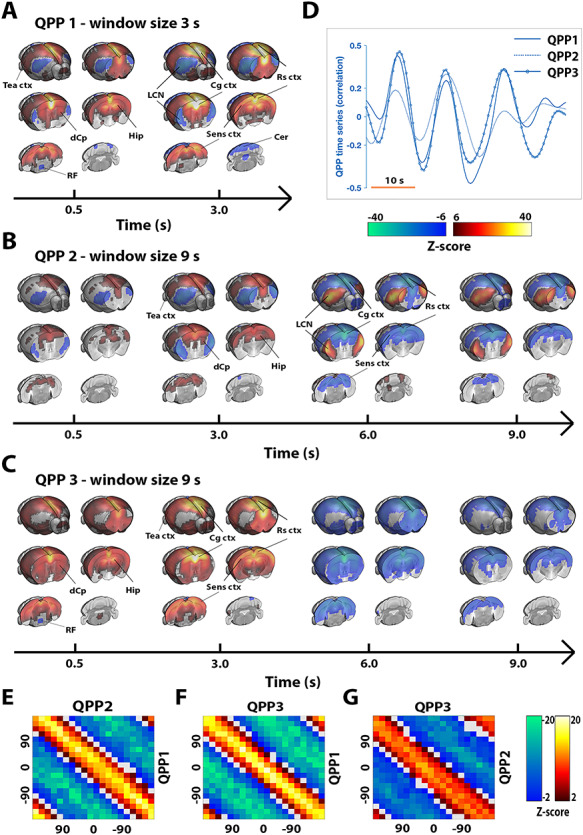
Three temporally colinear quasiperiodic brain fluctuations during resting state. Three QPPs were identified (A–C). QPP1 displayed a transient 3-s pattern capturing activation in DMN-like/sensory networks and deactivations in the LCN, QPP2 appeared similar as QPP1 but reverses in later frames, and QPP3 displayed cycling widespread activation and deactivation. Relevant brain areas are marked; DMN-like areas included Cg ctx, Rs ctx, Temporal association cortex (Tea ctx), Hip, and dCp. The 3 QPPs displayed a high degree of colinearity, evident both visually (D) and from phase–phase coupling (E–G). (A–G) n = 71 scans in 24 mice. (A–C) QPPs are displayed on the same time axis [alignment through cross-correlation of QPP correlation vectors (D)]. Maps display Z-scores [Z-test with H0 through randomized image averaging (n = 1000), FDR P < 10−7]. (D) Single subject excerpt. QPP correlation vectors represent Pearson correlations of QPPs with functional image series. (E–G) Phase–phase plots show Z-scores and are constructed from QPP correlation time series; center hot (yellow and red) diagonal marks strong co-phasic dynamics [first level Z-test with H0 through randomized circular shuffling (n = 1000); second level Z-test, FDR P < 0.05]. Hip, hippocampus; dCp, dorsal caudate putamen; Cg ctx, cingulate cortex; Rs ctx, retrosplenial cortex; Sens ctx, sensory cortex; Cer, cerebellum.