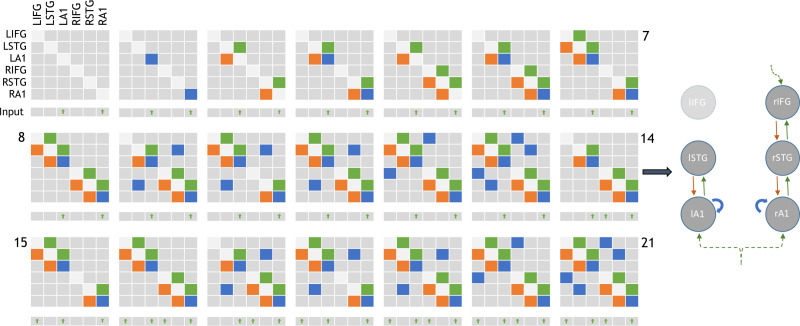
Figure 2.
Adjacency matrices showing the 21 model architectures tested, as per Phillips et al. (2015). Green, orange and blue blocks represent the presence of forward, backward and lateral (or self) connections modulating the mismatch effect, respectively. L/R-IFG = left/right-inferior frontal gyrus. Inputs are exogenous for sensory regions or endogenous for nonsensory regions. All driving inputs arrive in layer 4 of target regions. Model 14 (depicted right) was the overall winning model, in line with the results of Phillips et al. (2015).

