
Figure 1.
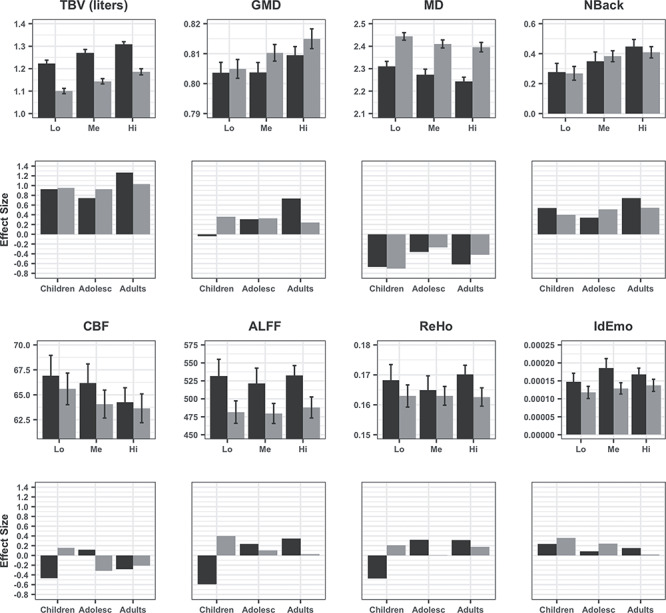
Global values for each modality by performance group (tertiles) in males (black) and females (gray). The first and third panels display means (±95% CI) of low (Lo), medium (Me), and high (Hi) tertiles of performers on volume, GMD, MD, CBF, ALFF, ReHo, NBack (Medial Frontal Gyrus), and IdEmo (Anterior Insula, Amygdala, Entorhinal Area). The second and fourth panels display effect sizes (Cohen’s D) for the differences between high and low performers on each parameter in children, adolescents, and young adults. All figures were made using the R package “ggplot2” (Wickham, 2011).