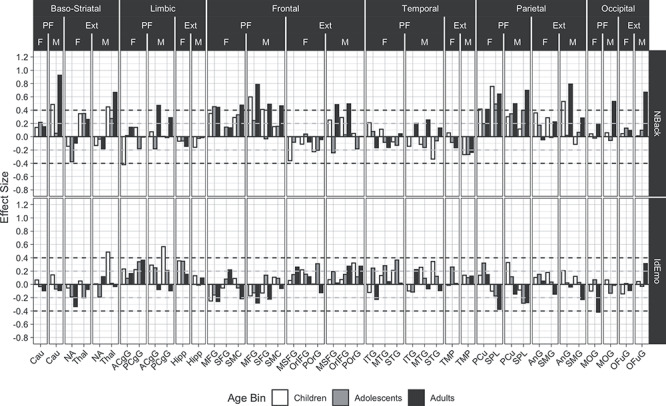
Figure 5.

Developmental and sex effects for the association between performance (our main cognitive performance measure, which was obtained out of scanner) and activation on the NBack and IdEmo tasks in the same regions as in previous Figures. The quality metric for these effects is the mean of the relative root mean square displacements. All other values, legends, and abbreviations are as in Figure 3.
