Figure 1.

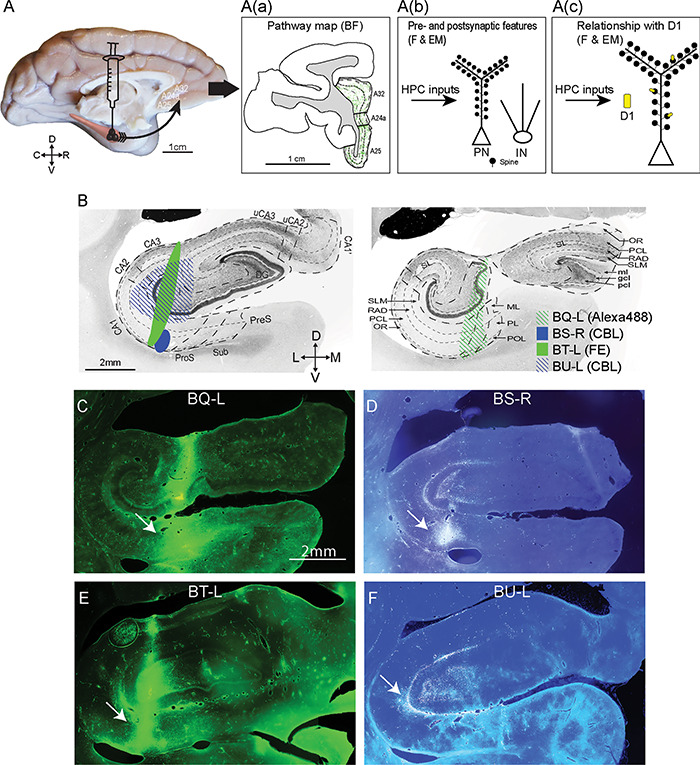
Experimental design and injection sites in the hippocampus. (A) Scheme of the anterograde fluorescent tracer trajectory: from projection neurons at the injection site (black cones) in the hippocampus along the axons to the ACC; the arrow shows the pathway direction. A(a) Immunohistochemistry: Mapping the hippocampal pathway terminations from coronal ACC sections with an antibody to each fluorescent tracer and processing tissue sections using DAB to visualize the pathway with brightfield microscopy (goal 1). A(b) Two methods were used to study presynaptic features and postsynaptic targets on distinct types of inhibitory neurons of hippocampal terminations: 1, Immunofluorescence: coronal sections through ACC showing the fluorescent labeled pathway from the hippocampal injection site were processed with an antibody against one of the calcium-binding proteins to study appositions of labeled hippocampal axonal boutons that made close contact with inhibitory postsynaptic sites using fluorescence microscopy; 2, Immunohistochemistry: double or triple immunohistochemistry was performed (as in A(a)) to view hippocampal axonal boutons in ACC using DAB, as well as for one or two calcium-binding proteins to label inhibitory postsynaptic sites using gold labeling or TMB to distinguish the labels for EM viewing. This tissue was used to study morphological features of hippocampal synapses and their postsynaptic targets (goal 2). A(c) Immunofluorescence: Study of the distribution of D1 receptors in A25 using an antibody against D1 receptors alone. Immunohistochemistry: The procedure described in A(b) was used to label hippocampal terminations using DAB and D1 receptors using TMB to visualize them simultaneously in EM to investigate their relationship (goal 3). Abbreviations: BF: brightfield microscopy. F: fluorescence. EM: electron microscopy. PN: pyramidal neuron. IN: inhibitory neuron. (B) Photomicrographs of coronal sections of the hippocampus stained for acetylcholinesterase show the subregions (left) and layers (right) (adapted from Wang and Barbas 2018). The representative sections were selected to match the level of the injection site in each case. Left panel: anterior level through hippocampus shows subregions (marked by thick dotted lines). Right panel: posterior level through hippocampus shows layers (marked by thin dotted lines). The shades indicate the location of the injection sites for each case. Abbreviations of tracers: CBL, cascade blue; FE, fluoroemerald. (C–F) Fluorescent photomicrographs show the injection sites in the hippocampus. The arrows in C–F point to the injection sites. Scale bars: A, 1 cm; B–F: 2 mm. C, caudal; D, dorsal; L, lateral; M, medial; R, rostral; V, ventral. Abbreviation of the subregions (B, left): DG, dentate gyrus; CA, cornu ammonis; uCA2, uncal CA2; uCA3, uncal CA3; ProS, prosubiculum; Sub, subiculum; PreS, presubiculum. Abbreviation of the layers (B, right): SLM, stratum lacunosum moleculare; RAD, stratum radiatum; PCL, stratum pyramidale; OR, stratum oriens; SL, stratum lucidum; ml, molecular layer; gcl, granule cell layer; pcl, polymorphic cell layer; ML, molecular layer; PL, pyramidal cell layer; POL, polymorphic cell layer.
