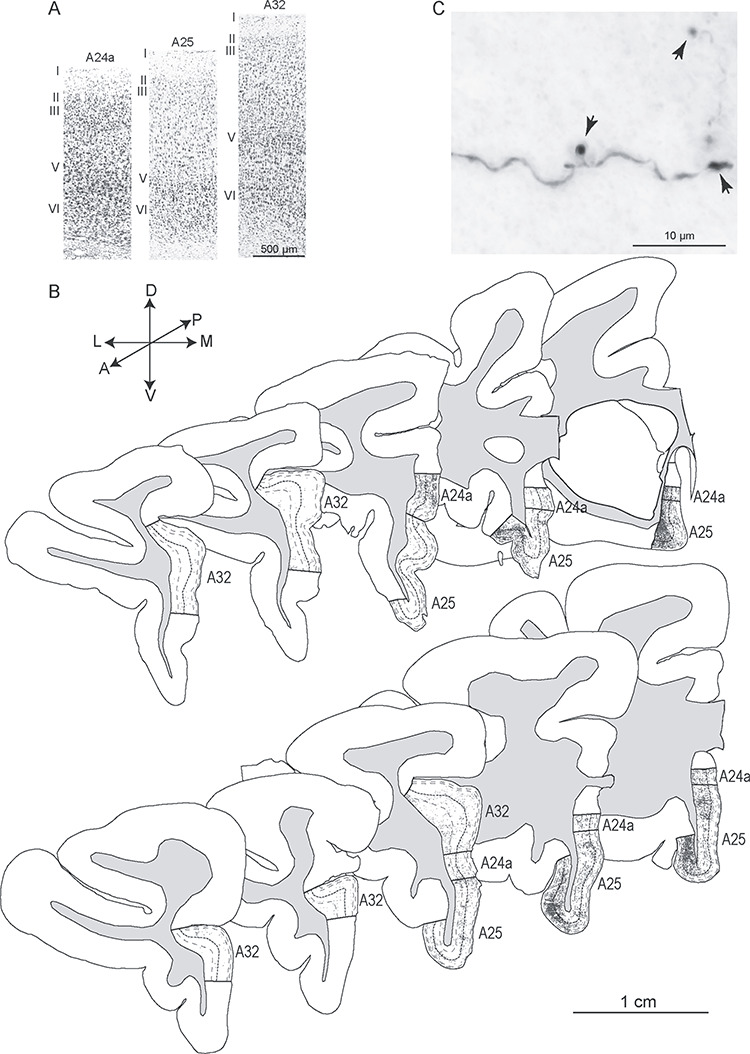
Figure 2.

Architecture of ACC areas and hippocampal axon terminals. (A) Photomicrographs of cortical columns from A24a, A25, and A32 stained with Nissl show the cytoarchitecture. (B) Diagrams of coronal sections show the distribution of labeled hippocampal axon terminals (dark gray) in A24a, A25, and A32 (case BQ, top panel; case BT, bottom panel) from anterior to posterior levels (left to right). The thick dotted lines indicate borders between upper (I–III) and deep (IV–VI) layers; thin dotted lines show border between layers I, II and III (upper) and V and VI (deep). Gray shade depicts the white matter. (C) Grayscale photomicrograph through A25 shows labeled hippocampal axon terminals (boutons, arrows). Scale bars: A, 500 μm; B: 1 cm; C: 10 μm.
