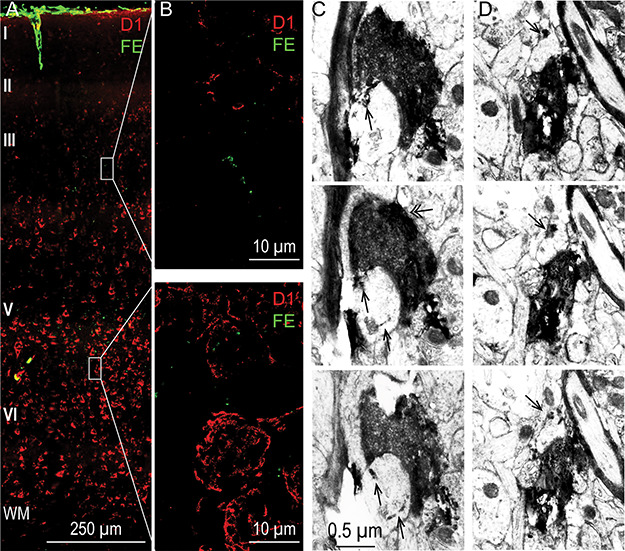
Figure 9.

Relationship of hippocampal terminations to D1 receptors in the upper and deep layers of A25. (A) Photomicrograph of cortical column through A25 processed for D1 receptors using immunofluorescence (red) and simultaneously labeled to visualize the hippocampal pathway terminations (green). Scale bar, 250 μm. (B) Enlarged site of the gray boxed areas from an upper layer (top panel) and a deep layer (bottom panel) site from A. (C, D) Two examples of hippocampal axon boutons (black) labeled with DAB that formed synapses on spines that contain D1 receptors (single arrow; D1 receptors were labeled with TMB); panels below show 2 adjacent EM sections for each hippocampal bouton revealing consistent label of D1 receptors in the innervated spines. Double-headed arrow (C, left): mitochondrion. Scale bar, 0.5 μm.
