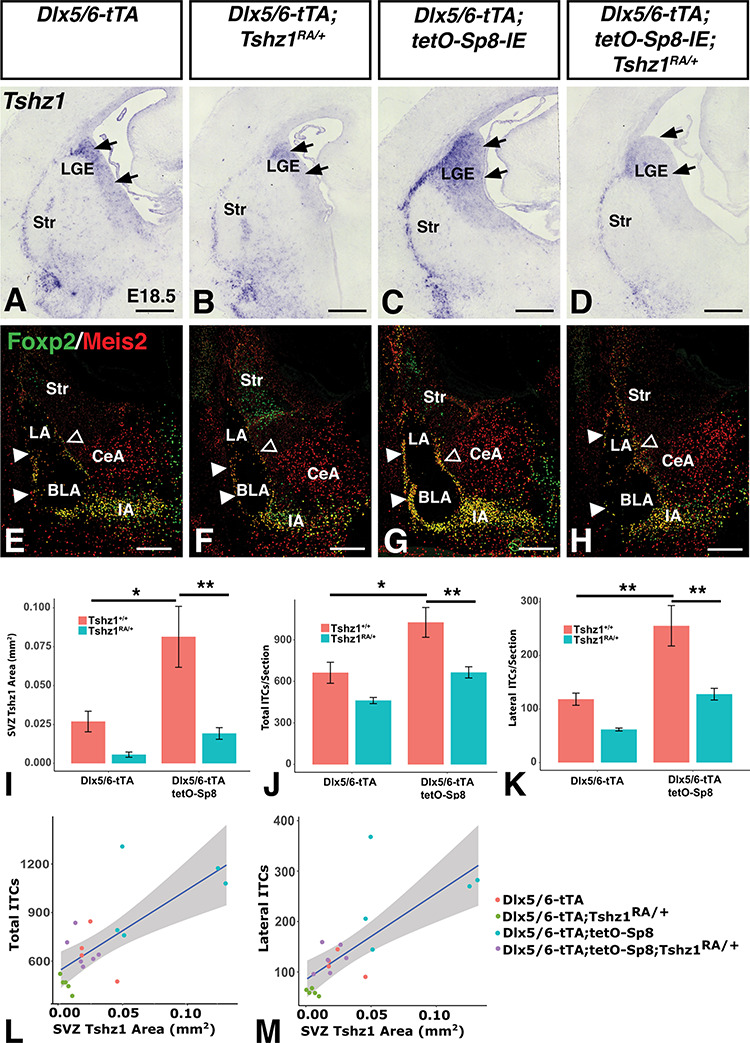
Figure 4.

Sp8-induced increase in ITC numbers is dependent on Tshz1 gene dosage. (A–D), Sp8 misexpressing mice (Dlx5/6-tTA;tetO-Sp8-IE, C) show expanded Tshz1 expression in the LGE SVZ (arrows) as well as in the lateral migratory stream toward the amygdala when compared to controls (A). Tshz1 heterozygosity (Tshz1RA/+) results in reduced Tshz1 expression in Sp8 misexpressing mice (D) as well as the Dlx5/6-tTA controls (B). (E–H) Furthermore, Sp8 misexpressing mice show increases in total and lateral ITC (marked by Foxp2/Meis2) numbers (G) as compared to controls (E). Tshz1 heterozygosity in Sp8 misexpressing mice restores ITC numbers to control levels (compare H with E). (I) Quantification of Tshz1 expression area from (A) to (D). J, Quantification of total ITCs from (E) to (H). (K) Quantification of lateral ITCs from (E) to (H). Data are represented as mean ± SEM and stats were performed using a two-way ANOVA with a post hoc Tukey HSD, *P < 0.05, **P < 0.01. (L) Correlation between total ITC number and Tshz1 expression area from (A) to (H). (M) Correlation between lateral ITC number and Tshz1 expression area from (A) to (H). BLA, basolateral amygdala; CeA, central amygdala; IA, main intercalated nucleus of the amygdala; ITCs, intercalated cells; LA, lateral amygdala; LGE, lateral ganglionic eminence; Str, striatum; SVZ, subventricular zone. Scale bars: A-D, 250 μm; E-H, 200 μm.
