Figure 5.

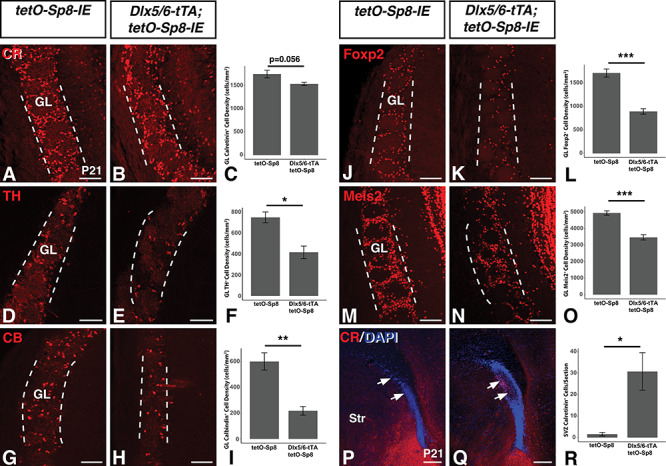
Sp8 misexpressing mice exhibit reductions in TH and CB expressing OB GL interneurons. (A–C) Immunofluorescence (A,B) and quantification (C) of CR expressing neurons in the postnatal olfactory bulb GL (between dashed lines) of Sp8 misexpressing mice which showed no significant effect. (D–F) Immunofluorescence (D,E) and quantification (F) of TH expressing neurons in the postnatal olfactory bulb GL (between dashed lines) of Sp8 misexpressing mice reveals a 43.9% decrease in TH+ cell density compared to controls. (G–I) Immunofluorescence (G,H) and quantification (I) of CB expressing neurons in the postnatal olfactory bulb GL (between dashed lines) of Sp8 misexpressing mice reveals a 63.8% decrease in CB+ cell density compared to controls. (J–L) Immunofluorescence (J,K) and quantification (L) of Foxp2 expressing neurons in the postnatal olfactory bulb GL (between dashed lines) of Sp8 misexpressing mice reveals a 47.8% decrease in Foxp2+ cell density compared to controls. (M–O) Immunofluorescence (M,N) and quantification (O) of Meis2 expressing neurons in the postnatal olfactory bulb GL (between dashed lines) of Sp8 misexpressing mice reveals a 29.8% decrease in Meis2+ cell density compared to controls. (P–R) Immunofluorescence (P,Q) and quantification (R) of CR expressing neurons in the postnatal SVZ of Sp8 misexpressing mice reveals an 18.5-fold increase in CR+ cells (arrows) compared to controls. Data are represented as mean ± SEM and stats performed using a Student’s t-test, *P<0.05, **P < 0.01, ***P < 0.001. GL, glomerular layer, Str, striatum. Scale bars: A–N, 100 μm; P,Q, 250 μm.
