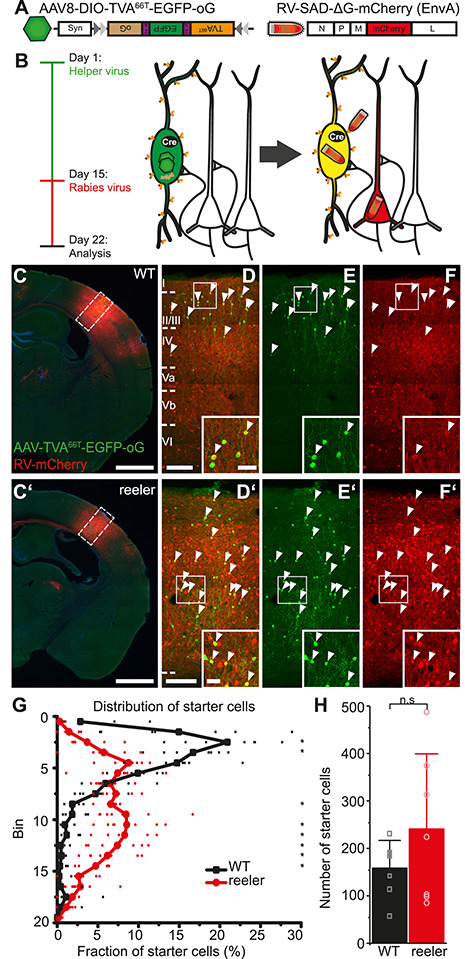
Figure 2.

RV tracing in VIP-Cre mice is based on a different distribution and number of VIP starter cells in WT and reeler mice. (A) Viral constructs for RV tracing. TVA66T is a mutated version of TVA, to which EnvA in the RV envelope has a reduced affinity. This ensures that low-level Cre-independent TVA expression does not permit RV entry into cells. oG is the optimized rabies glycoprotein necessary for transsynaptic spread. (B) Injection of Cre-dependent helper AAV on day 1 induces high expression of TVA66T and oG only in VIP cells. RV-mCherry pseudotyped with TVA-ligand EnvA is injected 14 days later to infect VIP neurons and spread from there to first-order presynaptic neurons using oG. Seven days later, starter VIP cells appear yellow due to the mixture of fluorophores; presynaptic neurons have solely mCherry. (C, C’) Coronal sections through an injection site in the barrel cortex of WT and reeler mice (scale bar: 1000 μm). (D/D’–F/F’) Inserts in C, C’. Cells marked by white arrowheads are double-labeled starter cells that have been co-transduced by AAV-TVA66T-EGFP-oG and RV-mCherry. Inserts at the bottom show some of these cells in higher resolution. Exclusively RV-mCherry-positive cells represent local inputs, presynaptic to the starter cells, forming an extremely dense network of cell bodies and neuropil at the injection site (scale bar overview: 100 μm; scale bar insert: 20 μm). (G) Distribution of starter cells across the cortical depth. Cortical thickness was divided into 20 equal-sized bins. The proportion of starter cells in each bin was plotted. While in WT starter cells were predominantly in the upper third, starter cells in reeler were much more dispersed (n = 7 per group; symbols connected by lines show average; small, transparent symbols show individual animals; asterisks highlight significantly different fractions per bin between genotypes with P < 0.05). (H) Number of starter cells in each genotype. (n = 7 per group; mean ± SD, symbols show individual animals; P > 0.05).
