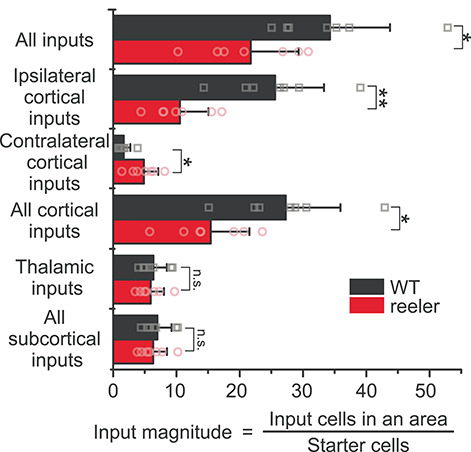
Figure 4.

Input magnitude from global cortical and subcortical areas highlights a cortical phenotype. Histograms representing the input magnitude from summed-up cell counts of brain areas. Reeler mice received overall less input per cell, which was due to less input from the ipsilateral cortex. Input from the contralateral hemisphere was increased in reeler, whereas subcortical input remained unaffected (n = 7 per group; mean ± SD; symbols show individual animals; *P < 0.05, **P < 0.01, n.s. P > 0.05).
