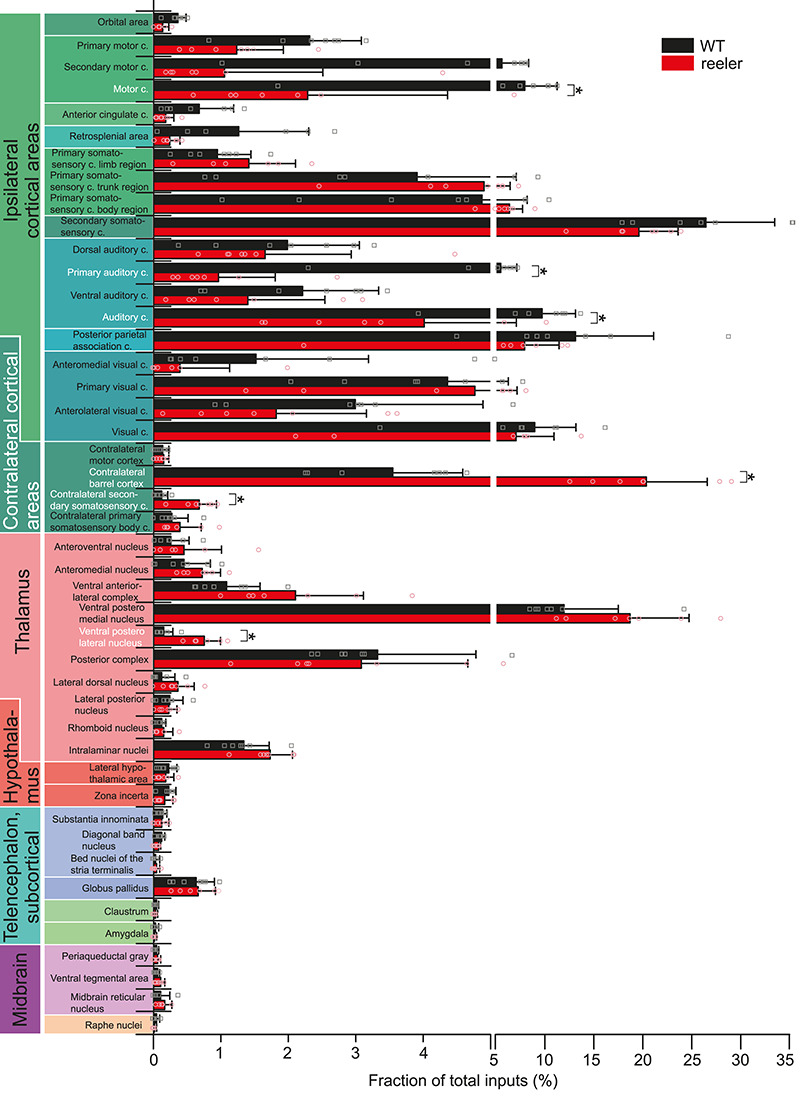
Figure 5.

Comparative analysis of the input fraction from individual brain areas. Mean proportion of RV-labeled cells in 41 individual areas normalized against the total number of inputs in the whole brain for the two genotypes. For motor cortex, primary somatosensory cortex body region, auditory cortex, and visual cortex, the summated proportions of the individual subareas are shown as well. Pairwise comparisons were carried out to assess differences in input fraction for individual areas (n = 7 per group; mean ± SD; symbols show individual animals; *P < 0.05; c, cortex).
