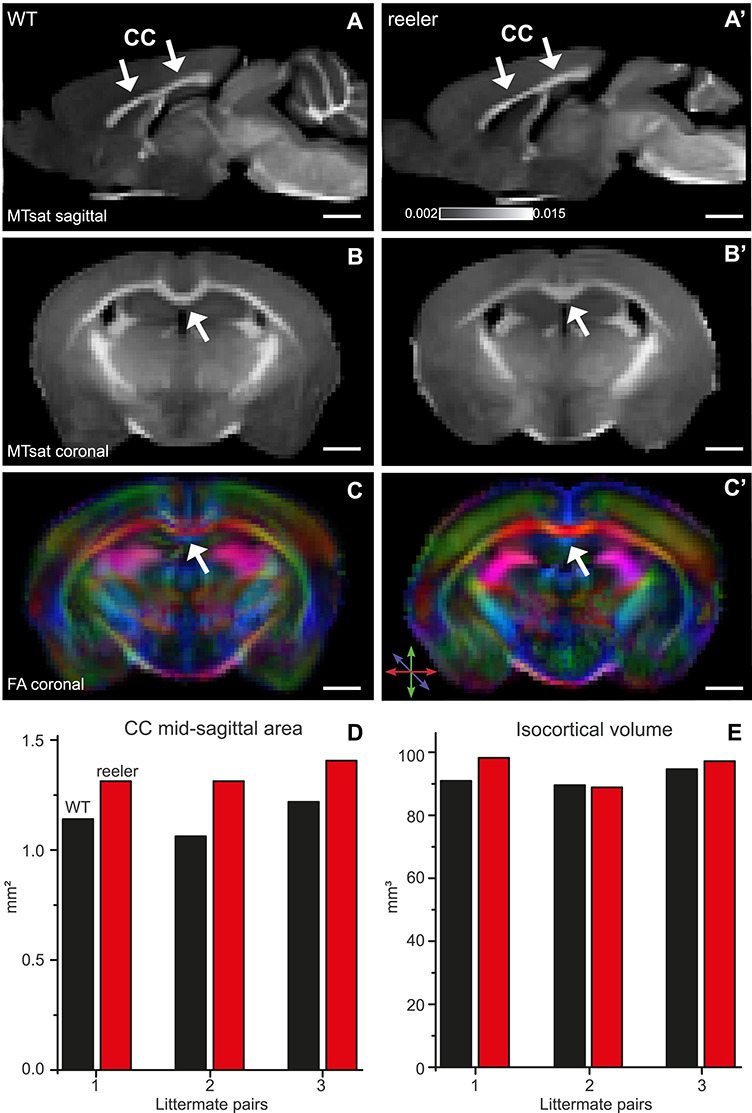
Figure 6.

MRI reveals a larger and differently shaped CC (arrows) in reeler. (A, A’) Sagittal maps of MTsat of WT and reeler mice brain acquired ex vivo. These maps were used to determine the dimensions of the CC. (B, B’) Coronal MTsat map of WT versus reeler mice. At the midline, the CC showed a different geometry between genotypes. In reeler mice, the characteristic curvature of WT mice was absent so that the top of the CC appeared flattened. (C, C’) FA maps show the color-coded directionality of fibers. Because fibers of the CC run in the mediolateral direction, they could be distinguished from whiter matter bundles more dorsally or more ventrally that run in the rostrocaudal direction. (D) Midsagittal area of the CC of individual WT and reeler mice compared between littermate pairs. In each pair, the reeler mouse had a larger area, probably indicating that it is composed of a higher number of callosal fibers. (E) Total isocortical volume of individual WT and reeler mice compared between littermate pairs. The volume was almost the same, except for one pair in which the reeler mouse showed a slightly higher volume.
