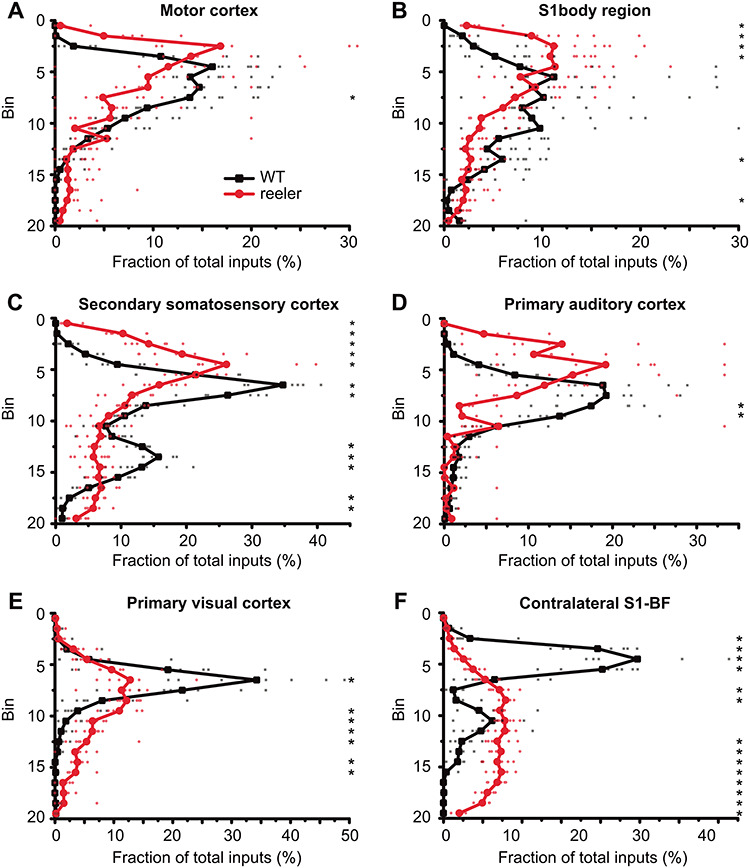
Figure 7.

Distribution of projection neurons in cortical input areas. (A–F) The thickness of the cortex was divided into 20 equal-sized bins. We plotted the fraction of inputs in a bin normalized against the total inputs of VIP cells from this area. In ipsilateral areas, the distribution of projection neurons had one peak that was usually shifted more superficially in reeler, except for visual cortex where the peak was just broader. The distribution of contralateral projection neurons from the barrel cortex was very different, with neurons in WT being mostly located in the upper third, while in reeler predominantly in the lower two thirds of the cortex (n = 7 per group; symbols connected by lines show average; small, transparent symbols show individual animals; asterisks highlight significantly different fractions per bin between genotypes with P < 0.05; S1, primary somatosensory cortex; BF, barrel field).
