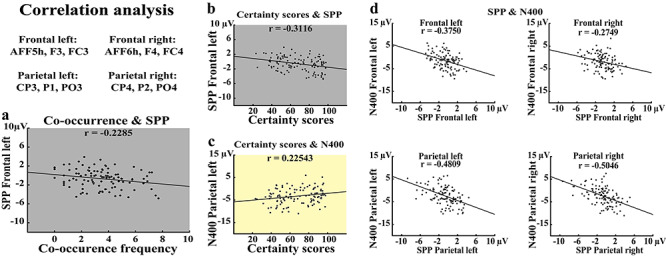
Figure 3.

Correlation analyses. Electrodes used for correlation analysis are shown at the top left. All correlations have been computed at sentence level by averaging the electrophysiological responses elicited by all the sentences across all participants. Negative correlation between the co-occurrence frequency and SPP responses at left-frontal electrodes is shown in panel (a) (bottom left). Negative correlation between the certainty scores (see Materials and Methods) and SPP responses at left-frontal electrodes is shown in panel (b). Positive correlation between the certainty scores and the N400 responses at left-parietal electrodes (i.e., the standard electrodes for N400 responses) is shown in panel (c). Negative correlations between SPP and N400 responses at left- and right-frontal and -parietal recording sites are shown, clockwise, in panel (d).
