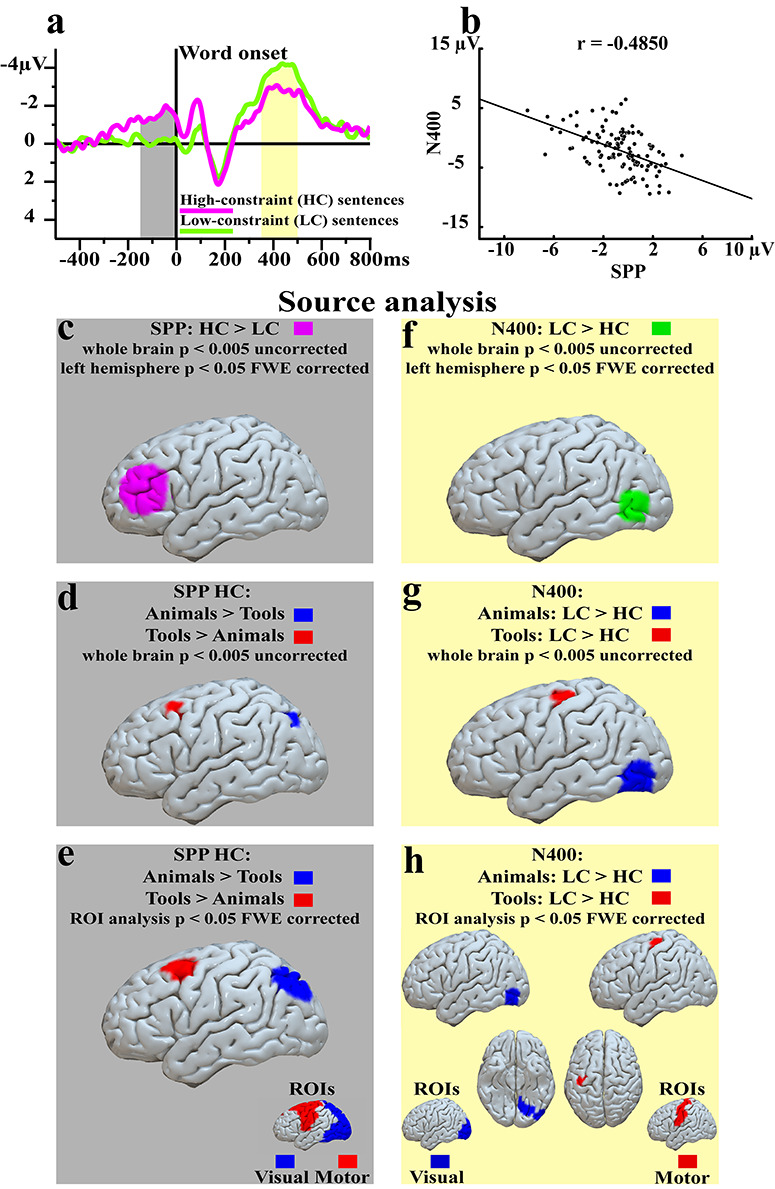
Figure 4.

Source analysis results. The top panels summarize main results of this study, SPP (relevant time window indicated by gray shading) and N400 (yellow shading) responses in HC and LC conditions (a) and the significant negative correlation between SPP and N400 responses (here averaged across centro-occipital recording sites) in (b). Below the top panels, the left column of panels reports sources of SPP contrasts (gray background), whereas the right column gives N400 contrasts (yellow background). (c) SPP latency: HC > LC contrast (magenta), P < 0.005 uncorrected, whole brain analysis. (d) SPP latency: HC animals > HC tools (blue) and HC tools > HC animals (red), P < 0.005 uncorrected, whole brain analysis. (e) SPP latency, Regions of interest (ROIs) analysis: HC animals > HC tools (blue) and HC tools > HC animals (red) P < 0.05 FWE corrected. (f) N400 latency: LC > HC contrast, (green), P < 0.005 uncorrected, whole brain analysis. (g) N400 latency: animals LC > HC (blue) and tools LC > HC (red) P < 0.005 uncorrected, whole brain analysis. (h) N400 latency, ROIs analysis: animals LC > HC (blue) and tools LC > HC (red) P < 0.05 FWE corrected.
