
Figure 4.
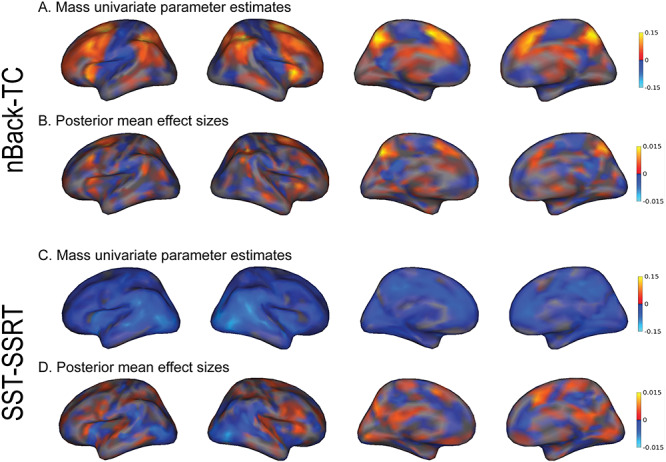
Distributed pattern of effects across the cortex for the nBack-TC and SST-SSRT associations. Unthresholded vertexwise mass univariate standardized parameter estimates and posterior mean effect sizes were displayed for the nBack-TC and SST-SSRT associations. The unthresholded mass univariate parameter estimates were used to calculate the PVSU and the posterior mean effect sizes were used to calculate the PVSB for each association. For the nBack-TC association, both mass univariate (A) and posterior mean effect size maps (B) showed distributed patterns of association across the cortex, suggesting that the association between imaging and behavioral phenotypes were global, spanning the whole cortex. Similar distributed patterns were found for the SST-SSRT association. Compared with the mass univariate statistical map (C), the posterior mean effect size map (D) of the SST-SSRT association showed greater variation in the relative weighting of brain regions on behavioral prediction, potentially contributing to the greater prediction accuracy for the PVSB compared with the PVSU for this association. The interpretation of the posterior mean effect size maps should be attempted with caution as the validity of these effect sizes rests upon the assumption of the global prior such that all vertices contribute to brain-behavior associations.