

Abstract

Lateral compartmentalization of the plasma membrane is a prominent feature present at multiple spatiotemporal scales that regulates key cellular functions. The extracellular glycocalyx matrix has recently emerged as an important player that modulates the organization of specific receptors and patterns the lipid bilayer itself. However, experimental limitations in investigating its impact on the membrane nanoscale dynamics have hampered detailed studies. Here, we used photonic nanoantenna arrays combined with fluorescence correlation spectroscopy to investigate the influence of hyaluronic acid (HA), a prominent glycosaminoglycan, on the nanoscale organization of mimetic lipid bilayers. Using atomic force microscopy and force spectroscopy, we further correlated our dynamic measurements with the morphology and mechanical properties of bilayers at the nanoscale. Overall, we find that HA has a profound effect on the dynamics, nanoscale organization, and mechanical properties of lipid bilayers that are enriched in sphingolipids and/or cholesterol, such as those present in living cells.
The plasma membrane of living cells is composed of a plethora of lipids and proteins that laterally compartmentalize at different spatiotemporal scales. This compartmentalization plays an important role in regulating key cellular functions.1,2 Much research has been devoted to identifying different molecular actors that are responsible for this dynamic, heterogeneous organization. Cholesterol-enriched nanodomains, known as lipid rafts,3−6 the cortical actin cytoskeleton,4,8−10 and the glycocalyx matrix, a mesh of sugars or glycans and proteins on the extracellular space, have been proposed as important modulators of membrane organization.11 Although the role of the glycocalyx matrix in regulating multiple functions has been known for decades,7,8 evidence of its implication in membrane organization is more recent. Using super-resolution microscopy and/or single-molecule imaging, we and others have revealed that glycans can modulate the degree of clustering, mobility, and/or molecular interactions of different membrane receptors, thereby regulating their function.9−12
These findings have also reignited studies of model membranes. Earlier work on mimetic membranes showed that certain glycosaminoglycans (GAGs), an important class of glycocalyx constituents, slow lipid diffusion depending on the concentration, chemical composition, and molecular weight of the carbohydrate polymers.13 Moreover, inhomogeneous glycan networks were found to repattern the spatial organization of cholesterol-containing multiphase lipid membranes by stabilizing large lipid domains at the characteristic scale of the glycan network.14 Surprisingly, homogeneously distributed glycan networks led to the full suppression of microscopic phase separation. These results indicate that glycans might alter the organization of not only specific receptors on the cell membrane but also, importantly, the lipid bilayer itself, by either synergizing with or overriding the effect of cholesterol. However, the effect of glycan layers on the nanoscale organization of cholesterol-containing membranes remains unknown, given the difficulty of creating these bilayers, and the limited number of techniques that can address the dynamic organization of membranes at the nanoscale.
Recently, we implemented planar photonic nanoantenna substrates together with fluorescence correlation spectroscopy (FCS) to monitor submillisecond dynamic events at nanoscale spatial dimensions on mimetic and living cell membranes, with single-molecule sensitivity.15−20 These metallic nanostructures enable enhancement and confinement of the excitation light into illumination hot spot regions of nanometric dimensions.21 Using this approach, we demonstrated the existence of dynamic nanoscopic heterogeneities as small as 10 nm in size, in mimetic and living plasma membranes, with microsecond time resolution.15,16 Here, we used this methodology to investigate the influence of GAGs on the nanoscale lipid organization of mimetic bilayers of different molecular compositions. We complemented these studies with atomic force microscopy (AFM) and force spectroscopy (AFM-FS) and correlated dynamic measurements with the morphology and mechanical properties of bilayers at the nanoscale. Overall, we find that GAGs and cholesterol synergistically contribute to the dynamic nanodomain partitioning of multicomponent membranes at the nanoscale.
For our experiments, we prepared supported lipid bilayers (SLBs) of different lipid compositions (see the Supporting Information): a single-component fluid bilayer of unsaturated 1,2-dioleoyl-sn-glycero-3-phosphocholine (DOPC); a binary mixture of DOPC and 18:0 sphingomyelin (SM) in equimolar proportions, i.e., DOPC/SM (1:1); and a ternary mixture of DOPC, SM, and 20 mol % cholesterol (Chol), i.e., DOPC/SM/Chol (2:2:1). The latter is known to phase-separate into microscopic liquid ordered (Lo) and liquid disordered (Ld) domains, which may coexist with gel-like SM-enriched domains.22,23 We further exposed the bilayers to hyaluronic acid (HA), the most abundant GAG in the extracellular space,24 to mimic the presence of the glycocalyx matrix and embedded the fluorescence dye DiD in the bilayers to allow for diffusion measurements, as previously reported.15,22,25
We first assessed by confocal microcopy the quality of the SLBs prior to HA incorporation and performed FCS on random locations to quantify DiD diffusion.22,25 The diffusion coefficient values for the different lipid bilayers are in good quantitative agreement with those reported previously,15,22 validating our preparation method (Table 1). Similar measurements were performed on the SLBs after exposure to HA solution. HA had no significant impact on the dye diffusion on DOPC or DOPC/SM (1:1) but induced a larger spread of the distribution of the dye diffusion coefficients (i.e., larger standard deviation) for the ternary mixtures (Table 1).
Table 1. Diffusion Coefficients D (mean ± standard deviation) for the Different Bilayers before and after HA Addition (see the Supporting Information) Measured on Glass Coverslips via Confocal FCS at Room Temperaturea.
| lipid composition | D (μm2/s) | D (μm2/s) from ref (22) | D (μm2/s) in the presence of HA |
|---|---|---|---|
| DOPC | 6.0 ± 0.3 | 6.3 ± 0.2 | 5.6 ± 0.4 |
| DOPC/SM (1:1) | 1.8 ± 0.4 | 2.6 ± 0.2 | 1.1 ± 0.6 |
| DOPC/SM/Chol (2:2:1) | 4.6 ± 0.9 (Ld); 0.4 ± 0.1 (Lo)b | 5.15 ± 0.15 (Ld); 0.255 ± 0.058 (Lo) | 4 ± 2 (Ld); 0.3 ± 0.2 (Lo)b |
Values are compared to those reported in ref (22) in the absence of HA. For each bilayer composition before and after HA addition, 12–25 measurements were performed in three independent experiments.
The distinction between the macroscopic Lo and Ld domains is based on the fluorescence intensity differences of DiD, because this dye preferentially partitions into Ld regions.25
We also performed dual-color confocal fluorescence imaging of DOPC/SM/Chol (2:2:1) (magenta) after HA (green) incubation (Figure 1a and Figure S1).
Figure 1.
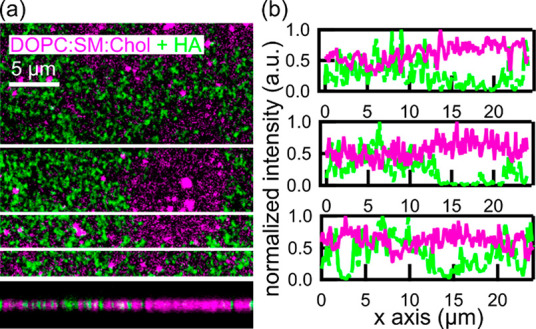
Dual-color confocal fluorescence imaging of DOPC/SM/Chol (2:2:1) in the presence of HA. (a) Representative merged fluorescence image of DOPC/SM/Chol (2:2:1) (magenta) and HA (green). The bottom image is a merged z projection along the uppermost white line of panel a. (b) Representative fluorescence profiles taken at different locations on the sample, as highlighted by the white lines in panel a.
Areas enriched with HA anticorrelate with regions enriched with DiD (Figure 1a,b). Because DiD preferentially partitions in the Ld phase,25 these results indicate that HA organization on ternary mixtures is not homogeneous, preferentially associating with the more ordered bilayer regions. Although confocal inspection provides the first insights into the potential effects of HA on the organization of ternary mixtures, its limited spatial resolution prevents detailed studies at the nanoscale.
To overcome these limitations, we switched to FCS measurements at the nanoscale using planar gold nanogap antennas. We used gold dimers spaced at different gap sizes (10–45 nm) embedded in nanometric apertures to minimize the surrounding background (Figure S2), as previously reported.15,18 Because the antennas are fabricated on gold substrates, we further adapted the SLB preparation protocol and validated first their quality by confocal microscopy (Figure S3). Individual antennas containing the SLB on top were illuminated using λ = 640 nm light with polarization parallel to the gap to achieve maximum field enhancement and confinement.15,18 The fluorescence intensity of diffusing DiD was recorded from individual antennas of different nanogap sizes and on multiple antennas. Note that because the inspection regions are at the nanoscale and over hundreds of different antennas, there is no need for continuous bilayer quality at the micrometer scale. After HA incubation, another series of antenna measurements was performed. Individual intensity traces were autocorrelated with time to generate FCS curves that were fitted with a two-component two-dimensional (2D) diffusion model to obtain the characteristic diffusion times. We chose a two-component fit to account for the fast diffusion through the confined antenna gap area τD, and a slower diffusion time arising from background and other contributions from the surrounding aperture.15,18 Finally, we plotted the τD values from multiple antennas as a function of the antenna gap size to derive FCS diffusion law plots at the nanoscale.26,27 From a linear fit of these plots, two parameters were obtained: diffusion coefficient D (slope of the curve) and y-intercept τ0 (extrapolation of the linear fit through the origin). τ0 provides information about the type of diffusion experienced by the dye in its environment; i.e., τ0 = 0 corresponds to Brownian diffusion, while τ0 > 0 indicates the existence of nanodomains at scales smaller than those that can be accessed by the employed technique.26,27
Figure 2a shows representative normalized FCS curves recorded on 10 nm gap antennas in DOPC bilayers before and after HA addition and compared to a representative confocal FCS measurement.
Figure 2.

FCS analysis of DOPC before and after HA addition. (a) Representative FCS curves obtained using a 10 nm gap antenna and in confocal mode. (b) FCS diffusion laws for the two bilayer conditions. The gray region is expanded in panel c to show measurements on three different gap sizes. (d) Normalized (norm.) spread in diffusion time τD as a function of gap size. The norm. spread is calculated as the percentage of the interquartile range divided by the respective median τD per gap size. Data correspond to 15–22 measurements before and after HA (confocal) and 19–29 antennas per gap size before and after HA, on three independent measurements.
Shorter τD values were obtained for the antennas as compared to confocal, confirming their extreme spatial confinement.15,18 Exposure to HA did not significantly affect DiD diffusion in the DOPC bilayer, in agreement with confocal FCS (see Table 1). We further generated FCS diffusion law plots for multiple antennas of different gap sizes and confocal illumination (Figure 2b,c). The resulting D values were similar, with a DDOPC of 6.4 ± 0.2 μm2/s and a DDOPC+HA of 6.3 ± 0.1 μm2/s, and compare well to those obtained by confocal FCS (Table 1). In addition, the τ0 values were similar and close to zero in both bilayers (τ0,DOPC = −7 ± 1 μs, and τ0,DOPC+HA = −6 ± 1 μs), confirming that DiD diffusion in DOPC remains Brownian at the nanoscale in the presence of HA. These results validate our gold nanogap antenna approach combined with FCS and demonstrate no sticky effects of the bilayer on top of the antenna. To assess the variations in diffusion times for different antennas, we calculated the normalized spread in diffusion times for each of the three gap areas for DOPC alone and DOPC with HA (Figure 2d) and included a similar spread accounting for the antenna fabrication inaccuracies. As expected, the fabrication uncertainty decreases with an increase in gap area because the fabrication becomes more accurate.18 A similar trend was found for DOPC alone and DOPC with HA, indicating that small deviations between measurements mostly stem from fabrication inaccuracies of the antennas. We also examined the SLBs by AFM (see the Supporting Information and Figure S4) and obtained similar topographic images on both bilayers. Altogether, the similar D values, negligible τ0, and unaltered topography indicate that DOPC bilayers remain homogeneous down to the nanoscale after being exposed to HA.
We then investigated the effect of HA on DOPC/SM (1:1) bilayers. Panels a–d of Figure 3 show representative AFM images for the binary mixture before and after HA addition. In both cases, domains of heterogeneous sizes were observed but HA affected their morphology.
Figure 3.

AFM and FCS analysis of DOPC/SM (1:1) before and after HA addition. (a and b) Representative AFM topography images before and after HA addition, respectively, together with 2 μm × 2 μm close-ups (c and d, respectively). (e and f) Breakthrough force (Fb) maps (pixel size of 63 nm) from the approximately same regions shown in panels c and d, respectively. (g and h) Corresponding breakthrough force (Fb) histograms. Values close or equal to zero [3% and 40% for DOPC/SM (1:1) before and after HA addition, respectively] were excluded from the histograms because they correspond to regions without a clear discontinuity in the approach force curve. (i) Dual-color confocal fluorescence image of a DOPC/SM bilayer (magenta) and HA layer (green) deposited on a glass coverslip. (j) Representative FCS curves obtained with a 10 nm gap antenna. (k) FCS diffusion laws for the two bilayer conditions (the inset focuses on the two smaller gaps). (l) Normalized spread in diffusion times for different antenna gap sizes. Data correspond to 18–27 antennas per gap size before and after HA incubation from two or three independent measurements.
While for DOPC/SM (1:1) the domain edges appear to be quite sharp, well-defined, and spiky, they become more homogeneously distributed and circularly shaped upon HA addition (Figure 3c,d). We further generated pixel-by-pixel force–separation curves on the close-up regions shown in panels c and d of Figure 3, calculated breakthrough force Fb (ref (28)) for each approach curve, and generated 2D Fb maps for DOPC/SM (1:1) before and after HA incubation (Figure 3e,f and Figure S5). Fb is directly related to the membrane lateral packing and, thus, characteristic of the chemical structure of the lipid molecules and of the bilayer’s composition when formed by more than one lipid.29Fb is furthermore affected by the surrounding environment altering lateral interactions between the lipid molecules.30
The Fb maps correlate well with the AFM topographical features; i.e., thicker domains in the topography image (Figure 3c) correspond to larger Fb values (Figure 3e) that can be attributed to the more ordered domains enriched with SM.31,32 To better quantify these results, we generated histograms of the Fb values (Figure 3g,h). The Fb histogram for DOPC/SM (1:1) exhibits a clear bimodal distribution with a lower force at ∼8 nN and a higher force with a larger spread at ∼38 nN (Figure 3g). The lower force is higher than that reported for a pure DOPC bilayer (∼4–5 nN),33 and thus, we assign its occurrence to the presence of Ld regions mainly composed of DOPC and a small fraction of SM. The second broader histogram, with a peak at ∼38 nN, lies within the range reported for gel-like membranes.34 The coexistence of gel-like domains in DOPC/SM membranes has been shown for compositions containing 23–81% SM, and nanodomains have been detected to occur already in the range of 10–15% SM.35−37 Therefore, we assign these higher rupture forces to SM regions of different packing densities containing fewer DOPC molecules. Interestingly, HA addition resulted in a much broader and unimodal distribution of Fb values centered around ∼29 nN (Figure 3h). These results indicate that the mechanical characteristics of coexisting phases in the DOPC/SM bilayers become indistinguishable upon HA addition.
To rationalize these results, we moved to fluorescence measurements. Confocal images of DOPC/SM (1:1) with HA confirmed HA preferential association with higher-order regions of the bilayer (i.e., where the DiD signal is weaker) (Figure 3i). Nanoscale FCS measurements by the antennas showed a considerable influence of HA on the dynamics of the DOPC/SM (1:1) bilayer. Measurements performed on the 10 nm antenna gap yielded a τD,DOPC:SM of 24 ± 3 μs and a τD,DOPC:SM+HA of 36 ± 4 μs for the curves shown in Figure 3j. Furthermore, the FCS diffusion law plots retrieved for both bilayers are markedly different (Figure 3k). In the absence of HA, the plots could be accurately fitted yielding a DDOPC:SM of 4.14 ± 0.03 μm2/s and a τ0 of 18 ± 4 μs and the normalized spread in τD became larger as the antenna gap size increased (Figure 3l). The positive τ0 values and larger spread in τD as a function of gap size are signatures for the existence of nanodomains of different sizes,15,26,27 consistent with our AFM measurements. Remarkably, HA addition led to a shift to longer and much more disperse diffusion times for all three investigated gap sizes, precluding a linear fitting of the FCS diffusion law plots (Figure 3k,l). Although we cannot reach conclusions about the nature of the interaction of HA with DOPC/SM (1:1) bilayers, our results show that HA has a major impact disturbing the full ordering of the bilayers down to 10 nm. Qualitatively, these results also agree with the Fb plots, in which distinct phases became indistinguishable in terms of rupture forces upon HA interaction (Figure 3h).
We finally assessed the effect of HA on DOPC/SM/Chol ternary lipid mixtures (2:2:1). AFM topography and phase shift contrast imaging38 before HA addition confirmed three different phases (arrows in Figure 4a, left), with the thickest domains being reminiscent of gel-like SM-enriched domains.23
Figure 4.

AFM and FCS analysis of DOPC/SM/Chol (2:2:1) before and after HA addition. (a and b) Representative AFM topography (left) and phase shift images (right) of the ternary lipid mixture before and after HA incubation, respectively. Arrows in panel a highlight the three different phases. (c) Representative FCS curves obtained with a 10 nm gap antenna. In absence of HA, the curves could be assigned to Ld or Lo phases (magenta and purple). (d) FCS diffusion laws at the nanoscale for three different gap sizes. (e) Normalized spread in diffusion times. Data correspond to 15–22 antennas per gap size before and after HA incubation, from two or three independent measurements.
HA addition visibly perturbed the bilayers, so that the three-lipid phases could not be identified (Figure 4b). Because these samples were highly difficult to image and appeared systematically blurrier due to an increased number of tip–sample interactions, we moved to nanoscale FCS measurements. Representative FCS curves for the 10 nm gap antenna are shown in Figure 4c. The two representative correlation curves for the ternary mixture in the absence of HA correspond to DiD diffusion in the Ld (i.e., shorter diffusion times) and Lo (i.e., longer diffusion times) phases.15 In the presence of the HA layer, these phases became indistinguishable and DiD diffusion was significantly slower. Figure 4d shows the τD versus three gap sizes for multiple antennas. In the absence of HA, we recover two characteristic diffusion coefficients DLd = 6 ± 1 μm2/s and DLo = 2.1 ± 0.4 μm2/s and positive offsets of τLd = 32 ± 9 μs and τLo = 190 ± 10 μs corresponding to nanodomains inside Ld and Lo phases, respectively, in full agreement with our previous findings15 and validating our combined nanoantenna–FCS approach. Similarly, the normalized spread in τD also confirmed the existence of nanoscopic heterogeneities within both phases (Figure 4e).15 Remarkably, in the presence of HA, the diffusion times became highly broad, regardless of the gap size (Figure 4d). Accordingly, the spread in τD became much larger, even for the smallest gap size, suggesting a considerable HA–lipid interaction at ≤10 nm (Figure 4e). We propose that HA stabilizes and further enhances the nanoscopic heterogeneities that already coexist in the ternary mixture due to cholesterol. Both the results by AFM and on the nanoantennas confirm the influence of the HA layer on the micro- and nanoscale lipid organization.
Both SM and HA have a high H-bonding capacity facilitating bonds formed between the OH groups of HA and the NH groups of SM.39,40 Via these bonds, HA could partially penetrate between the SM headgroups, which would contribute to the partitioning of the membrane.39,41 One hypothesis, to be tested using more chemically sensitivity methods, is that HA plays an intercalating role, in a manner similar to that of cholesterol but mainly in the lipid headgroup region, to induce or facilitate nanodomain formation in lipid mixtures containing SM. Earlier confocal investigations showed that homogeneously distributed glycan networks suppress microscopic phase separation on ternary mixtures containing cholesterol.14 Our experiments at the nanoscale reveal that HA preferentially interacts with SM and synergizes with cholesterol, inducing and enhancing the formation of nanoscopic heterogeneities in multicomponent lipid membranes. We reconcile our findings with the results of those confocal studies by postulating that HA enhances the formation of nanoscopic lipid heterogeneities that may appear as microscopically “smeared out” or homogeneous when inspected by techniques that lack the required nanometric spatial resolution. Despite the simplicity of the pure lipidic bilayers studied here, our results might have implications for our understanding of living cell membranes, which are abundant in glycolipids and glycoproteins. Glycan repatterning of the lipid bilayer might have consequences for the way proteins and lipids dynamically interact with each other and thus potentially influence their function.
Acknowledgments
The authors acknowledge support from the European Commission H2020 Program under Grant Agreement ERC Adv788546 (NANO-MEMEC) (to M.F.G.-P.); the Government of Spain (Severo Ochoa CEX2019-000910-S, FIS2017-89560-R to M.F.G.-P. and RYC-2017-22227 and AEI/PID2019-106232RB-I00/10.13039/501100011033 to F.C.); Generalitat de Catalunya through the CERCA program and AGAUR (Grants 2017-SGR-1442 to M.I.G. and 2017-SGR-1000 to M.F.G.-P.); the CIBER-BBN FlexCAB project (to M.I.G.); Fundació CELLEX (Barcelona) and Fundació Mir-Puig. P.M.W. is supported by the ICFOstepstone Fellowship, a COFUND Doctoral Programme of the Marie Skłodowska-Curie Action of the European Union’s Horizon 2020 research and innovation programme under Marie Skłodowska-Curie Grant Agreement 665884.
Supporting Information Available
The Supporting Information is available free of charge at https://pubs.acs.org/doi/10.1021/acs.jpclett.0c03439.
Materials and Experimental Methods and supporting figures, including confocal FCS of a ternary lipid bilayer in the presence of HA deposited on a glass coverslip, a sketch of the experimental approach, confocal FCS of a ternary lipid bilayer in the presence of HA deposited on a gold substrate, nanoscale topography of a single-component lipid bilayer before and after HA addition, and force–distance curves of DOPC/SM (1:1) before and after HA addition (PDF)
The authors declare no competing financial interest.
Supplementary Material
References
- García-Parajo M. F.; Cambi A.; Torreno-Pina J. A.; Thompson N.; Jacobson K. Nanoclustering as a Dominant Feature of Plasma Membrane Organization. J. Cell Sci. 2014, 127, 4995–5005. 10.1242/jcs.146340. [DOI] [PMC free article] [PubMed] [Google Scholar]
- Ma Y.; Hinde E.; Gaus K. Nanodomains in Biological Membranes. Essays Biochem. 2015, 57, 93–107. 10.1042/bse0570093. [DOI] [PubMed] [Google Scholar]
- Brown D. A.; London E. Functions of Lipid Rafts in Biological Membranes. Annu. Rev. Cell Dev. Biol. 1998, 14, 111–136. 10.1146/annurev.cellbio.14.1.111. [DOI] [PubMed] [Google Scholar]
- Kusumi A.; Nakada C.; Ritchie K.; Murase K.; Suzuki K.; Murakoshi H.; Kasai R. S.; Kondo J.; Fujiwara T. Paradigm Shift of the Plasma Membrane Concept from the Two-Dimensional Continuum Fluid to the Partitioned Fluid: High-Speed Single-Molecule Tracking of Membrane Molecules. Annu. Rev. Biophys. Biomol. Struct. 2005, 34, 351–378. 10.1146/annurev.biophys.34.040204.144637. [DOI] [PubMed] [Google Scholar]
- Simons K.; Ikonen E. Functional Rafts in Cell Membranes. Nature 1997, 387, 569–572. 10.1038/42408. [DOI] [PubMed] [Google Scholar]
- Mayor S.; Rao M. Rafts: Scale-Dependent, Active Lipid Organization at the Cell Surface: Raft Hypothesis. Traffic 2004, 5, 231–240. 10.1111/j.1600-0854.2004.00172.x. [DOI] [PubMed] [Google Scholar]
- Lanctot P. M.; Gage F. H.; Varki A. P. The Glycans of Stem Cells. Curr. Opin. Chem. Biol. 2007, 11, 373–380. 10.1016/j.cbpa.2007.05.032. [DOI] [PMC free article] [PubMed] [Google Scholar]
- Haltiwanger R. S.; Lowe J. B. Role of Glycosylation in Development. Annu. Rev. Biochem. 2004, 73, 491–537. 10.1146/annurev.biochem.73.011303.074043. [DOI] [PubMed] [Google Scholar]
- Paszek M. J.; DuFort C. C.; Rossier O.; Bainer R.; Mouw J. K.; Godula K.; Hudak J. E.; Lakins J. N.; Wijekoon A. C.; Cassereau L.; et al. The Cancer Glycocalyx Mechanically Primes Integrin-Mediated Growth and Survival. Nature 2014, 511, 319–325. 10.1038/nature13535. [DOI] [PMC free article] [PubMed] [Google Scholar]
- Torreno-Pina J. A.; Castro B. M.; Manzo C.; Buschow S. I.; Cambi A.; García-Parajo M. F. Enhanced Receptor-Clathrin Interactions Induced by N-Glycan-Mediated Membrane Micropatterning. Proc. Natl. Acad. Sci. U. S. A. 2014, 111, 11037–11042. 10.1073/pnas.1402041111. [DOI] [PMC free article] [PubMed] [Google Scholar]
- Freeman S. A.; Vega A.; Riedl M.; Collins R. F.; Ostrowski P. P.; Woods E. C.; Bertozzi C. R.; Tammi M. I.; Lidke D. S.; Johnson P.; et al. Transmembrane Pickets Connect Cyto- and Pericellular Skeletons Forming Barriers to Receptor Engagement. Cell 2018, 172, 305–317. 10.1016/j.cell.2017.12.023. [DOI] [PMC free article] [PubMed] [Google Scholar]
- Sil P.; Mateos N.; Nath S.; Buschow S.; Manzo C.; Suzuki K. G. N.; Fujiwara T.; Kusumi A.; García-Parajo M. F.; Mayor S. Dynamic Actin-Mediated Nano-Scale Clustering of CD44 Regulates Its Meso-Scale Organization at the Plasma Membrane. Mol. Biol. Cell 2020, 31, 561–579. 10.1091/mbc.E18-11-0715. [DOI] [PMC free article] [PubMed] [Google Scholar]
- Sahoo H.; Schwille P. Influence of Glycosaminoglycans on Lipid Dynamics in Supported Phospholipid Bilayers. Soft Matter 2013, 9, 3859–3865. 10.1039/c3sm26906j. [DOI] [Google Scholar]
- Subramaniam A. B.; Guidotti G.; Manoharan V. N.; Stone H. A. Glycans Pattern the Phase Behaviour of Lipid Membranes. Nat. Mater. 2013, 12, 128–133. 10.1038/nmat3492. [DOI] [PubMed] [Google Scholar]
- Winkler P. M.; Regmi R.; Flauraud V.; Brugger J.; Rigneault H.; Wenger J.; García-Parajo M. F. Transient Nanoscopic Phase Separation in Biological Lipid Membranes Resolved by Planar Plasmonic Antennas. ACS Nano 2017, 11, 7241–7250. 10.1021/acsnano.7b03177. [DOI] [PubMed] [Google Scholar]
- Regmi R.; Winkler P. M.; Flauraud V.; Borgman K. J. E.; Manzo C.; Brugger J.; Rigneault H.; Wenger J.; García-Parajo M. F. Planar Optical Nanoantennas Resolve Cholesterol-Dependent Nanoscale Heterogeneities in the Plasma Membrane of Living Cells. Nano Lett. 2017, 17, 6295–6302. 10.1021/acs.nanolett.7b02973. [DOI] [PubMed] [Google Scholar]
- Winkler P. M.; Regmi R.; Flauraud V.; Brugger J.; Rigneault H.; Wenger J.; García-Parajo M. F. Optical Antenna-Based Fluorescence Correlation Spectroscopy to Probe the Nanoscale Dynamics of Biological Membranes. J. Phys. Chem. Lett. 2018, 9, 110–119. 10.1021/acs.jpclett.7b02818. [DOI] [PubMed] [Google Scholar]
- Flauraud V.; Regmi R.; Winkler P. M.; Alexander D. T. L.; Rigneault H.; van Hulst N. F.; García-Parajo M. F.; Wenger J.; Brugger J. In-Plane Plasmonic Antenna Arrays with Surface Nanogaps for Giant Fluorescence Enhancement. Nano Lett. 2017, 17, 1703–1710. 10.1021/acs.nanolett.6b04978. [DOI] [PubMed] [Google Scholar]
- Flauraud V.; van Zanten T. S.; Mivelle M.; Manzo C.; García-Parajo M. F.; Brugger J. Large-Scale Arrays of Bowtie Nanoaperture Antennas for Nanoscale Dynamics in Living Cell Membranes. Nano Lett. 2015, 15, 4176–4182. 10.1021/acs.nanolett.5b01335. [DOI] [PubMed] [Google Scholar]
- Punj D.; Mivelle M.; Moparthi S. B.; van Zanten T. S.; Rigneault H.; van Hulst N. F.; García-Parajo M. F.; Wenger J. A Plasmonic ‘Antenna-in-Box’ Platform for Enhanced Single-Molecule Analysis at Micromolar Concentrations. Nat. Nanotechnol. 2013, 8, 512–516. 10.1038/nnano.2013.98. [DOI] [PubMed] [Google Scholar]
- Novotny L.; van Hulst N. Antennas for Light. Nat. Photonics 2011, 5, 83–90. 10.1038/nphoton.2010.237. [DOI] [Google Scholar]
- Kahya N.; Scherfeld D.; Bacia K.; Poolman B.; Schwille P. Probing Lipid Mobility of Raft-Exhibiting Model Membranes by Fluorescence Correlation Spectroscopy. J. Biol. Chem. 2003, 278, 28109–28115. 10.1074/jbc.M302969200. [DOI] [PubMed] [Google Scholar]
- Aufderhorst-Roberts A.; Chandra U.; Connell S. D. Three-Phase Coexistence in Lipid Membranes. Biophys. J. 2017, 112, 313–324. 10.1016/j.bpj.2016.12.025. [DOI] [PMC free article] [PubMed] [Google Scholar]
- Fraser J. R. E.; Laurent T. C.; Laurent U. B. G. Hyaluronan: Its Nature, Distribution, Functions and Turnover. J. Intern. Med. 1997, 242, 27–33. 10.1046/j.1365-2796.1997.00170.x. [DOI] [PubMed] [Google Scholar]
- Sezgin E.; Levental I.; Grzybek M.; Schwarzmann G.; Mueller V.; Honigmann A.; Belov V. N.; Eggeling C.; Coskun Ü.; Simons K.; et al. Partitioning, Diffusion, and Ligand Binding of Raft Lipid Analogs in Model and Cellular Plasma Membranes. Biochim. Biophys. Acta, Biomembr. 2012, 1818, 1777–1784. 10.1016/j.bbamem.2012.03.007. [DOI] [PubMed] [Google Scholar]
- Wawrezinieck L.; Rigneault H.; Marguet D.; Lenne P.-F. Fluorescence Correlation Spectroscopy Diffusion Laws to Probe the Submicron Cell Membrane Organization. Biophys. J. 2005, 89, 4029–4042. 10.1529/biophysj.105.067959. [DOI] [PMC free article] [PubMed] [Google Scholar]
- Lenne P.-F.; Wawrezinieck L.; Conchonaud F.; Wurtz O.; Boned A.; Guo X.-J.; Rigneault H.; He H.-T.; Marguet D. Dynamic Molecular Confinement in the Plasma Membrane by Microdomains and the Cytoskeleton Meshwork. EMBO J. 2006, 25, 3245–3256. 10.1038/sj.emboj.7601214. [DOI] [PMC free article] [PubMed] [Google Scholar]
- García-Manyes S.; Sanz F. Nanomechanics of Lipid Bilayers by Force Spectroscopy with AFM: A Perspective. Biochim. Biophys. Acta, Biomembr. 2010, 1798, 741–749. 10.1016/j.bbamem.2009.12.019. [DOI] [PubMed] [Google Scholar]
- Gumí-Audenis B.; Costa L.; Carlá F.; Comin F.; Sanz F.; Giannotti M. Structure and Nanomechanics of Model Membranes by Atomic Force Microscopy and Spectroscopy: Insights into the Role of Cholesterol and Sphingolipids. Membranes 2016, 6, 58. 10.3390/membranes6040058. [DOI] [PMC free article] [PubMed] [Google Scholar]
- Crespo-Villanueva A.; Gumí-Audenis B.; Sanz F.; Artzner F.; Mériadec C.; Rousseau F.; Lopez C.; Giannotti M. I.; Guyomarc’h F. Casein Interaction with Lipid Membranes: Are the Phase State or Charge Density of the Phospholipids Affecting Protein Adsorption?. Biochim. Biophys. Acta, Biomembr. 2018, 1860, 2588–2598. 10.1016/j.bbamem.2018.09.016. [DOI] [PubMed] [Google Scholar]
- Connell S. D.; Smith D. A. The Atomic Force Microscope as a Tool for Studying Phase Separation in Lipid Membranes (Review). Mol. Membr. Biol. 2006, 23, 17–28. 10.1080/09687860500501158. [DOI] [PubMed] [Google Scholar]
- Guyomarc’h F.; Chen M.; Et-Thakafy O.; Zou S.; Lopez C. Gel-Gel Phase Separation within Milk Sphingomyelin Domains Revealed at the Nanoscale Using Atomic Force Microscopy. Biochim. Biophys. Acta, Biomembr. 2017, 1859, 949–958. 10.1016/j.bbamem.2017.02.010. [DOI] [PubMed] [Google Scholar]
- Gumí-Audenis B.; Costa L.; Redondo-Morata L.; Milhiet P.-E.; Sanz F.; Felici R.; Giannotti M. I.; Carlá F. In-Plane Molecular Organization of Hydrated Single Lipid Bilayers: DPPC:Cholesterol. Nanoscale 2018, 10, 87–92. 10.1039/C7NR07510C. [DOI] [PubMed] [Google Scholar]
- Gumí-Audenis B.; Sanz F.; Giannotti M. I. Impact of Galactosylceramides on the Nanomechanical Properties of Lipid Bilayer Models: An AFM-Force Spectroscopy Study. Soft Matter 2015, 11, 5447–5454. 10.1039/C5SM01252J. [DOI] [PubMed] [Google Scholar]
- Nyholm T. K. M.; Lindroos D.; Westerlund B.; Slotte J. P. Construction of a DOPC/PSM/Cholesterol Phase Diagram Based on the Fluorescence Properties of Trans -Parinaric Acid. Langmuir 2011, 27, 8339–8350. 10.1021/la201427w. [DOI] [PubMed] [Google Scholar]
- Veatch S. L.; Keller S. L. Miscibility Phase Diagrams of Giant Vesicles Containing Sphingomyelin. Phys. Rev. Lett. 2005, 94, 148101. 10.1103/PhysRevLett.94.148101. [DOI] [PubMed] [Google Scholar]
- Koukalová A.; Amaro M.; Aydogan G.; Gröbner G.; Williamson P. T. F.; Mikhalyov I.; Hof M.; Šachl R. Lipid Driven Nanodomains in Giant Lipid Vesicles Are Fluid and Disordered. Sci. Rep. 2017, 7, 5460. 10.1038/s41598-017-05539-y. [DOI] [PMC free article] [PubMed] [Google Scholar]
- Eaton P. J.; West P.. Atomic Force Microscopy; Oxford University Press: Oxford, U.K., 2010. [Google Scholar]
- Ramstedt B.; Slotte J. P. Sphingolipids and the Formation of Sterol-Enriched Ordered Membrane Domains. Biochim. Biophys. Acta, Biomembr. 2006, 1758, 1945–1956. 10.1016/j.bbamem.2006.05.020. [DOI] [PubMed] [Google Scholar]
- Giannotti M. I.; Rinaudo M.; Vancso G. J. Force Spectroscopy of Hyaluronan by Atomic Force Microscopy: From Hydrogen-Bonded Networks toward Single-Chain Behavior. Biomacromolecules 2007, 8, 2648–2652. 10.1021/bm700592j. [DOI] [PubMed] [Google Scholar]
- Mombelli E.; Morris R.; Taylor W.; Fraternali F. Hydrogen-Bonding Propensities of Sphingomyelin in Solution and in a Bilayer Assembly: A Molecular Dynamics Study. Biophys. J. 2003, 84, 1507–1517. 10.1016/S0006-3495(03)74963-7. [DOI] [PMC free article] [PubMed] [Google Scholar]
Associated Data
This section collects any data citations, data availability statements, or supplementary materials included in this article.