
Figure 1.
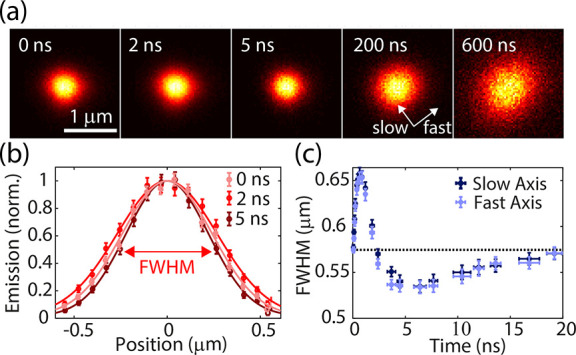
(a) The evolution of the spatial distribution of the (normalized) fluorescence from singlet excitons for an initial excitation density of 1018 cm–3. (b) Cross sections illustrating the expansion of the fluorescence spot from 0 (pink) to 2 ns (red), followed by a reduction at 5 ns (dark red) to a size smaller than the excitation spot. (c) The isotopic evolution of the fwhm during the first 20 ns.