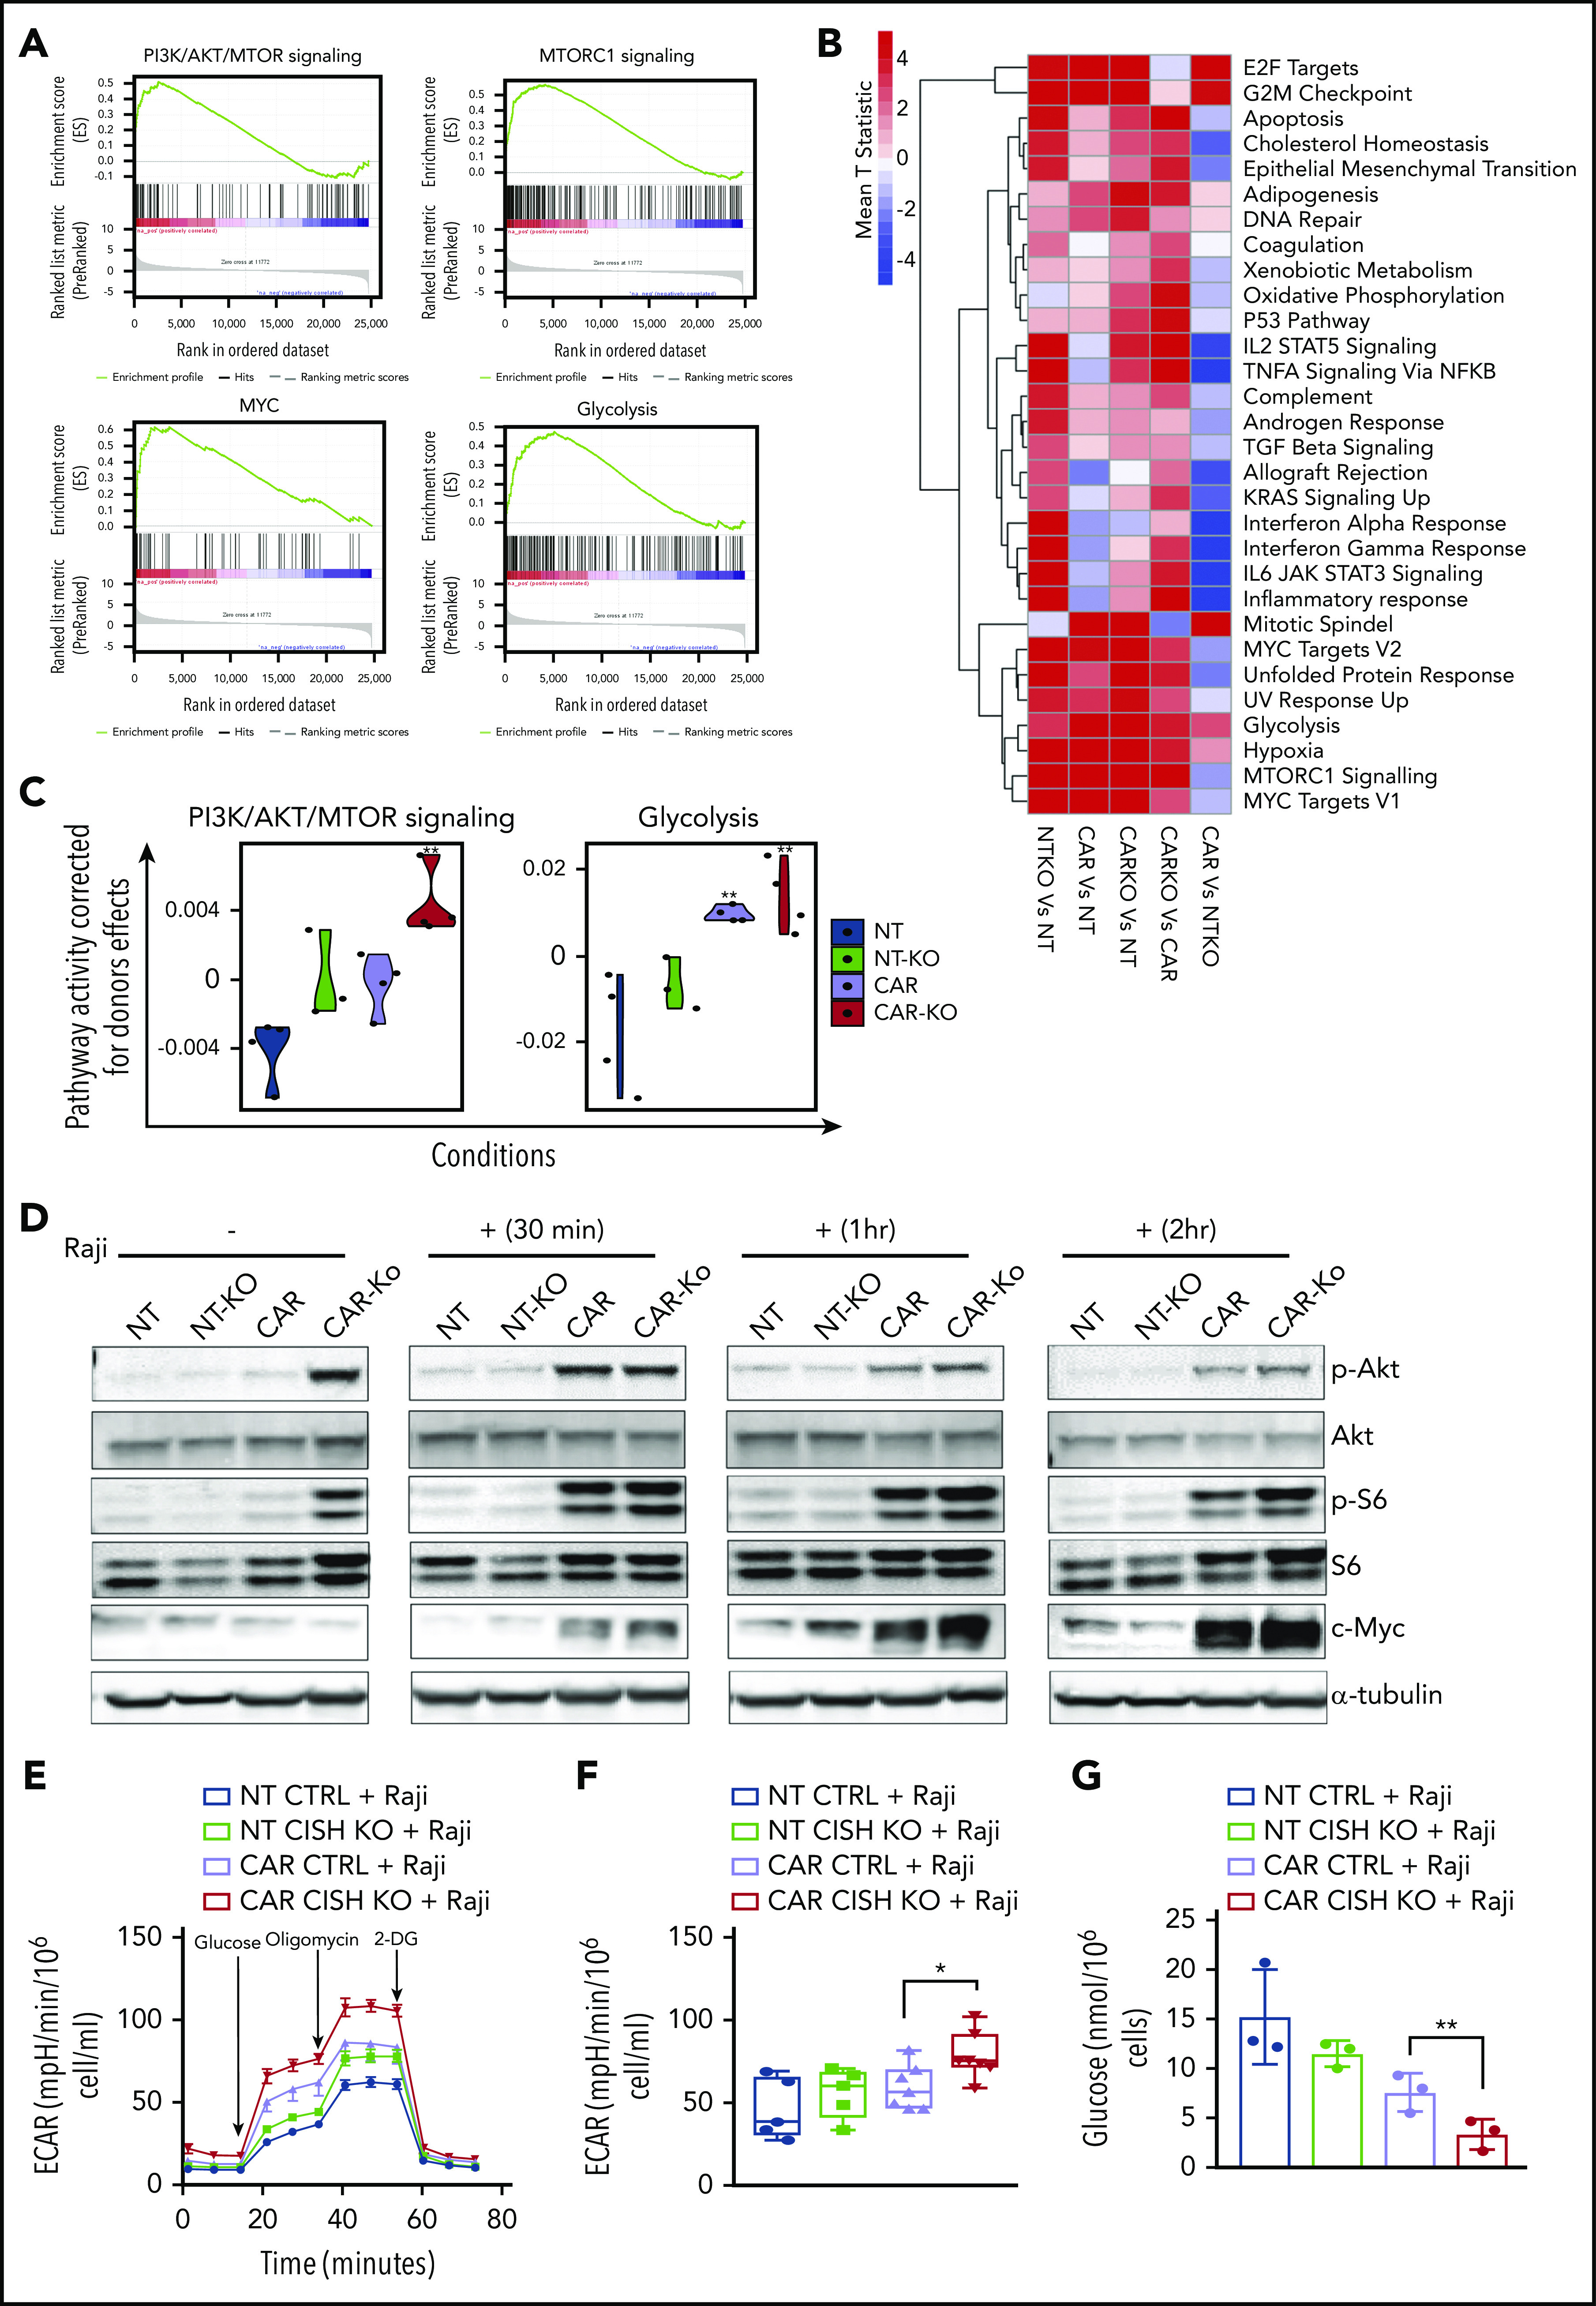
Figure 4.

Metabolic changes associated with iC9/CAR19/IL-15 CISH KO NK cells. (A) GSEA plots showing enrichment in PI3K/Akt/MTOR, mTORC1, MYC, and glycolysis pathways in iC9/CAR19/IL-15 CISH KO NK cells compared with iC9/CAR19/IL-15 control NK cells. (B) Comparative mean T statistic heat map of RNA sequencing data showing the expression of metabolic pathways in NT control (NT), NT CISH KO (NTKO), iC9/CAR19/IL-15 control (CAR), or iC9/CAR19/IL-15 CISH KO (CARKO) NK cells that are significantly different (q < 0.01) in ≥1 of the 5 comparisons. Each column represents a separate comparison, and each row reflects the expression of a certain hallmark pathway for each annotation. Color scale indicates signal intensity, ranging from lower (blue) to higher (red) expression. (C) Violin plots showing PI3K/Akt/mTORC1 and glycolysis signaling in NT (blue), NT-KO (green), CAR (purple), or CAR-KO (red) NK cells after correction for donor effect. Pathway activity of samples is regressed against donor and the residual is the corrected pathway activity. P values reported are computed relative to NT using the linear regression approach discussed in Materials and methods. **P ≤ .01. (D) NT control (NT), NT CISH KO (NT-KO), iC9/CAR19/IL-15 control (CAR), or iC9/CAR19/IL-15 CISH KO (CAR-KO) NK cells were cultured without (−) or with (+) Raji cells for 30 minutes, 1 hour, or 2 hours; NK cells were then purified, and the protein expression levels of p-Akt, Akt, p-S6, S6, c-MYC, and α-tubulin in NK cells were determined by western blot analysis. Representative blots from 2 independent experiments are shown. (E) A series of ECARs was calculated for NT control (blue lines), NT CISH KO (green lines), iC9/CAR19/IL-15 control (purple lines), or iC9/CAR19/IL-15 CISH KO (red lines) NK cells cocultured with Raji targets for 2 hours and subsequently purified and treated with 2 g/L d-glucose, 1 μM oligomycin, and 100 mM 2-deoxyglucose (2-DG). A representative graph from 5 independent experiments is shown. (F) Box plots summarize the ECAR data by NT control (blue box), NT CISH KO (green box), iC9/CAR19/IL-15 control (purple box), or iC9/CAR19/IL-15 CISH KO (red box) NK cells cocultured with Raji (n = 5). Statistical significance is indicated as *P ≤ .05; bars represent mean values with standard deviation. (G) Bar graph summarizes the glucose concentration in the supernatant of the different NK cell conditions cocultured with Raji for 2 hours: NT control (blue), NT CISH KO (green), iC9/CAR19/IL-15 control (purple), or iC9/CAR19/IL-15 CISH KO (red) NK cells (n = 3). Bars represent mean values with standard deviation (**P ≤ .01).
