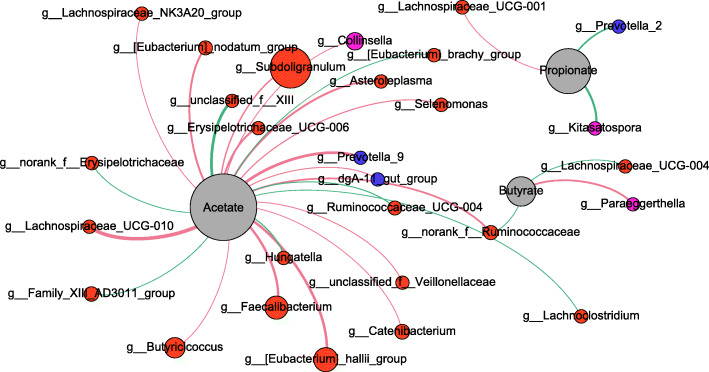
Fig. 7.
Correlation network analysis between short-chain fatty acid (SCFA) levels and the microbiota of IUGR and NBW pigs. Networks display Spearman’s correlations between the relative abundance of bacterial genus and SCFAs concentrations. Only correlations with corrected P value < 0.05 are illustrated. Nodes are colored according to phylum, and the size is proportional to the mean relative abundance within the population. Blue edges represent negative correlation, while pink edges represent positive correlation. The thickness of edges is proportional to the correlation coefficient

