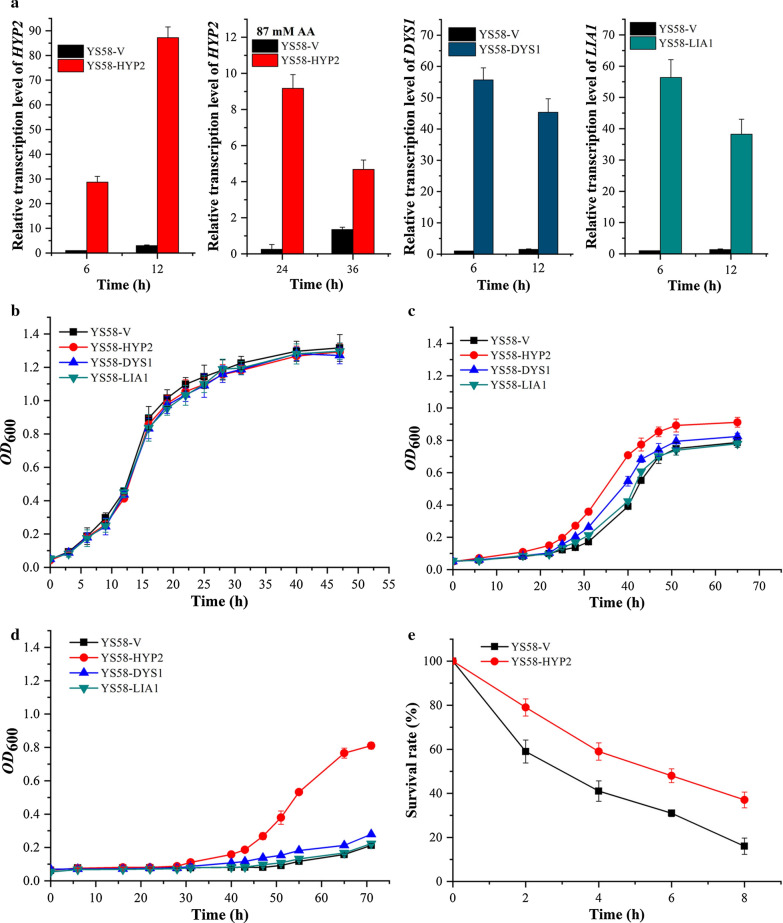
Fig. 2.
Expression levels of eIF5A relative genes and growth curves of different yeast strains. a Relative transcription levels of HYP2, DYS1 and LIA1 under conditions with or without acetic acid stress. The relative transcription levels of HYP2, DYS1 and LIA1 in the control strain YS58-V under non-stressed condition were defined as a value of 1. b Cell growth without acetic acid. c Cell growth in the presence of 87 mM acetic acid (pH 4.2). d Cell growth in the presence of 105 mM acetic acid (pH 4.2). e Survival assay of different yeast strains after 210 mM acetic acid treatment (pH 4.2). Data are presented as the means of the results of three independent experiments. Error bars represent standard deviations

