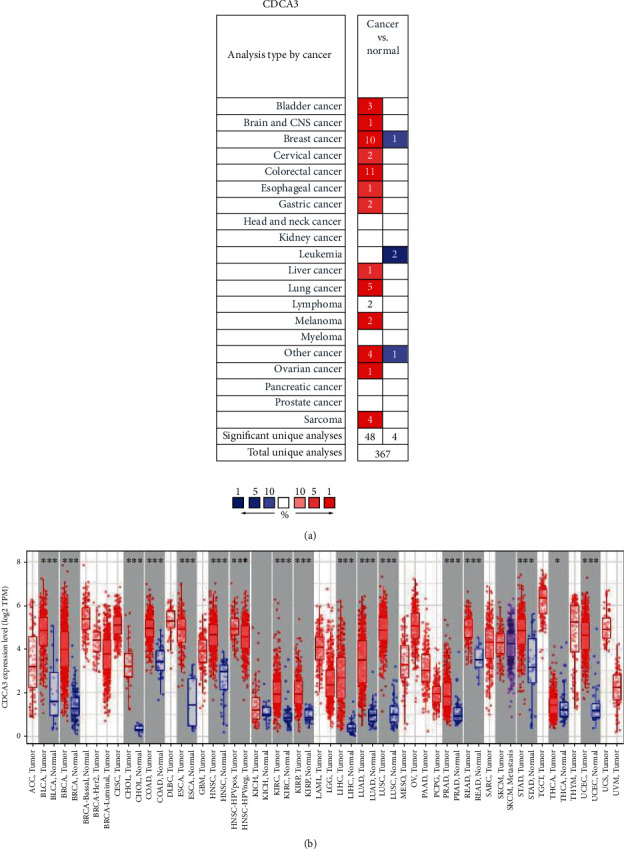
Figure 1.

CDCA3 expression in different types of human cancers. (a) High or low expression of CDCA3 in tumor tissues of different human cancers compared with normal tissues using the ONCOMINE database (p value of 0.0001, fold change of 2, and gene rank of top 10%.) Note: the number in the blank of (a) represents the amount of the corresponding datasets; the color of the blank in (a) is determined by the best gene rank percentile for the analyses within the cell. (b) The levels of CDCA3 expression in 17 types of human cancers including tumor tissues and normal tissues from TCGA database in TIMER. Note: ∗p < 0.05, ∗∗p < 0.01, and ∗∗∗p < 0.001.
