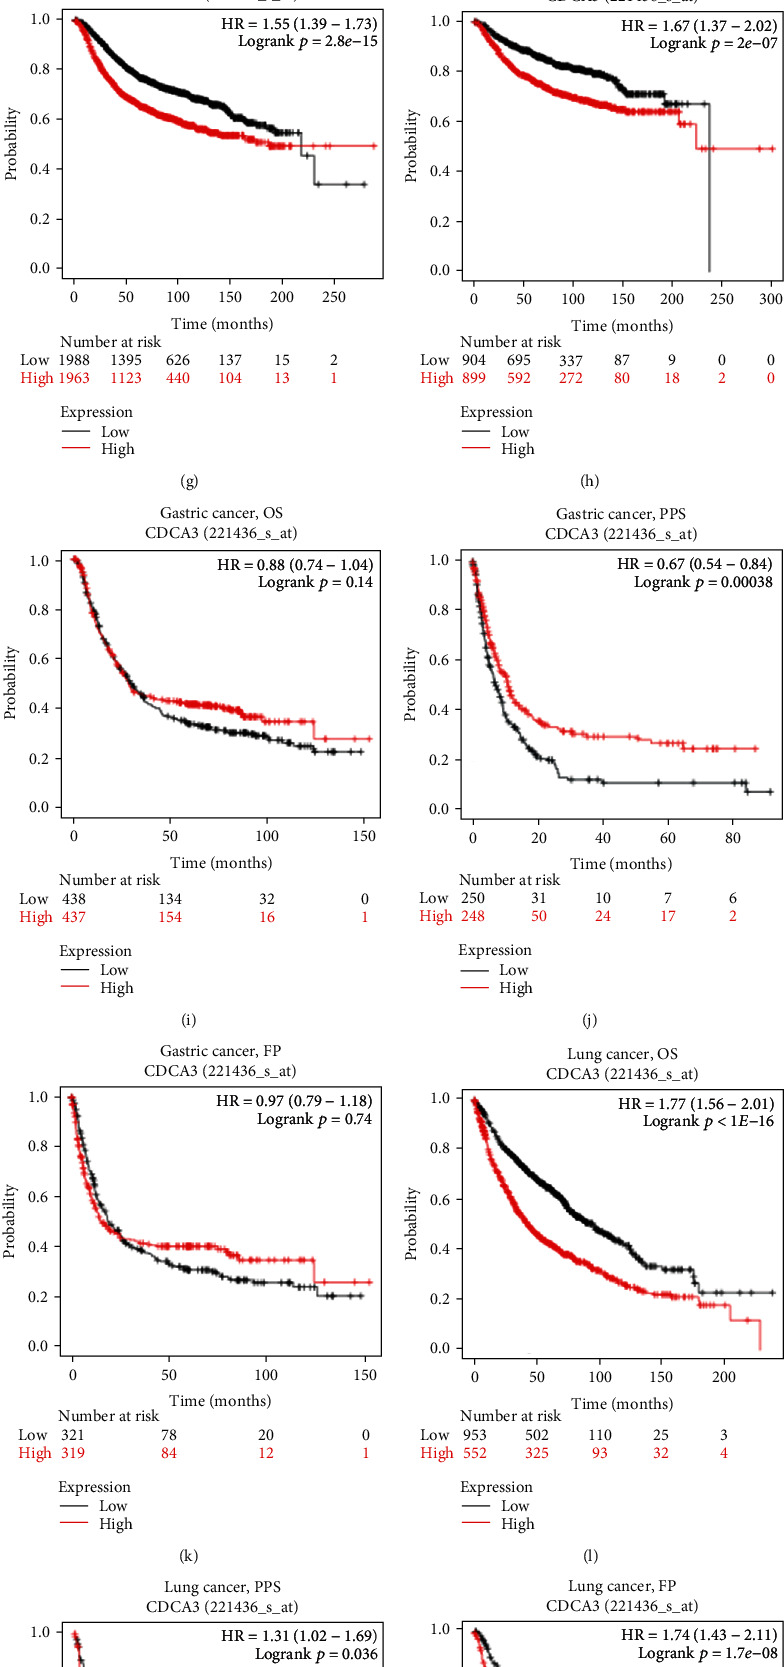
Figure 2.

Kaplan–Meier survival curve analysis of the prognostic significance of high and low expression of CDCA3 in different types of human cancers using the Kaplan–Meier plotter database. (a–d) Survival curves of OS, PFS, RFS, and DSS (n = 364, n = 370, n = 316, and n = 362) in HCC. (e–h) Survival curves of OS, PPS, RFS, and DMFS (n = 1402, n = 414, n = 3951, and n = 1803) in the breast cancer. (i–k) Survival curves of OS, PPS, and FP (n = 875, n = 498, and n = 640) in gastric cancer. (l–n) Survival curves of OS, PPS, and FP (n = 1925, n = 344, and n = 982) in lung cancer. (o–q) Survival curves of OS, PFS, and PPS (n = 1656, n = 1135, and n = 782) in ovarian cancer. OS: overall survival; PFS: progression-free survival; RFS: relapse-free survival; DSS: disease-specific survival; DMFS: distant metastasis-free survival; PPS: postprogression survival; FP: first progression. Note: HR (hazard ratio) represents the ratio of the risk rate produced by the application of high expression of CDCA3 to the risk rate produced by low expression of CDCA3 on survival; logrank p < 0.05 was statistically significant; the counts of patients at risk were listed under the survival plots.
