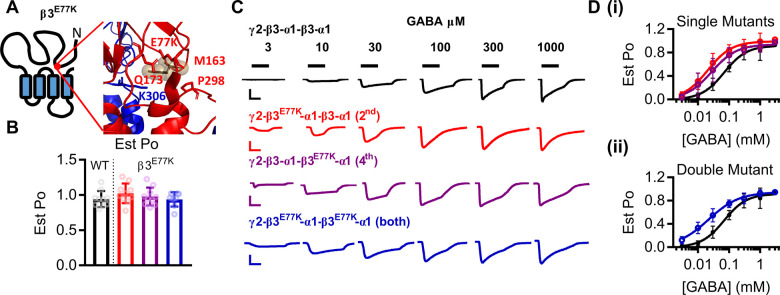
Figure 3.
Gain-of-function molecular phenotype of β3E77K variant. (A) The location of the β3E77K variant in a schematic of the β3 subunit and in the protein structure displaying a close-up of the coupling interface between the extracellular and transmembrane regions. (B) Bar graphs representing individual experiments (dots) and the mean ± SD for the estimated open probability of WT (black) and β3E77K constructs containing one copy of the variant in the 2nd subunit (red), one copy in the 4th subunit (purple) and two copies in the 2nd and 4th subunit (blue). The estimated open probability was calculated by comparing the response at 3 mM GABA to the response at 10 mM GABA, 3 μM etomidate and 1 μM diazepam. (C) Representative traces of currents recorded from Xenopus oocytes injected with WT (black) and β3E77K constructs containing one copy of the variant in the 2nd subunit (red), one copy in the 4th subunit (purple) and two copies in the 2nd and 4th subunit (blue). GABA concentrations were applied as indicated by the black bars to construct the concentration–response curves. Scale bars indicate 200 nA and 30 s, except for the blue bar that represents 50 nA and 30 s. (D) Concentration–response curves of WT and (i) concatenated constructs containing the β3E77K variant in the 2nd (red) or 4th subunit and (ii) the concatenated construct containing a β3E77K variant in the 2nd and 4th subunits. Symbols represent mean ± SD and data were fitted to the Hill equation.

