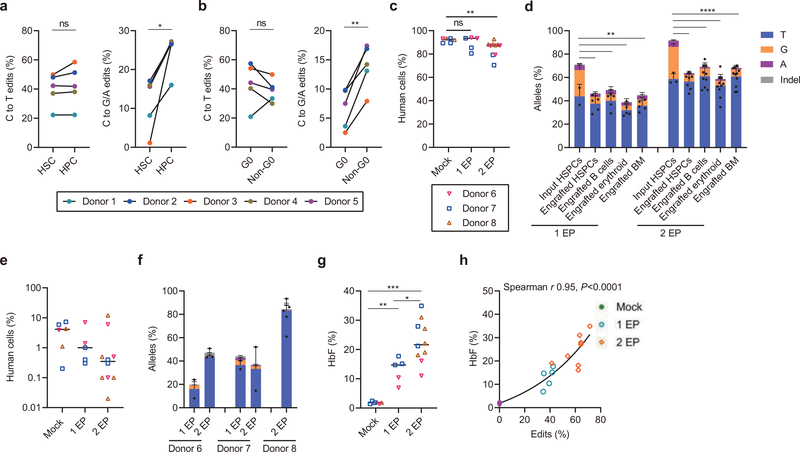
Fig. 4 |. Efficient C>T base editing in HSCs.
a-b, CD34+ HSPCs were electroporated with A3A (N57Q)-BE3:sgRNA-1620 RNP (40 μM) 24 hours after thawing cryopreserved cells. After an additional two hours cells were sorted by FACS. After 4 days of culture, base edits were evaluated by amplicon deep sequencing. a, Frequencies of C>T base editing (left) and C>G/A base editing (right) at sgRNA-1620 C6 position in sorted immunophenotypically enriched HSC (CD34+ CD38- CD90+ CD45RA-) or HPC (CD34+ CD38+) populations. Data are analyzed using paired two-tailed Student’s t-test, ns for nonsignificant, * P=0.015 C>G/A base edits in HSC compared with HPC, n=5 independent healthy donors. b, Frequencies of C>T base editing (left) and C>G/A base editing (right) at sgRNA-1620 C6 position in Pyronin Y and Hoechst stained and sorted G0 and non-G0 including G1, S and G2/M phase CD34+ HSPCs. Data are analyzed using paired two-tailed Student’s t-test, ns for nonsignificant, * P=0.0025 C>G/A base edits in G0 compared with non-G0, n=5 independent healthy donors. c, Following A3A(N57Q)-BE3:sgRNA-1620 RNP (40 μM) base editing with one or two cycles of electroporation, 800,000 live HSPCs, counted immediately prior to infusion, were infused to NBSGW mice. Human bone marrow chimerism 16 weeks following base edited HSPC infusion. Data are plotted as grand median and analyzed using Kolmogorov-Smirnov test, ns for nonsignificant. ** P=0.0017 comparing human chimerism of mock with 2 EP, n=6 mice from mock, n=5 mice from 1 EP, n=10 mice from 2 EP. d, Base editing at C6 position in engrafting HSPCs, B cells, erythroid cells and unfractionated bone marrow after 16 weeks as compared with input HSPCs following 1 or 2 cycles of electroporation (1 EP, 2 EP). Each dot indicates one mouse recipient. Data are plotted as mean±s.d. and analyzed using unpaired two-tailed Student’s t-test, ** P<0.01, C>G/A base edits in engrafting cells vs. input cells following one cycle of electroporation, P=0.0034 engrafted HSPCs vs. input HSPCs, P= 0.0041 engrafted B cells vs. input HSPCs, P=0.0019 engrafted erythroid cells vs. input HSPCs, P= 0.0015 engrafted BM vs. input HSPCs, n=2 independent healthy donors from input HSPCs, n=5 primary recipients. **** P<0.0001 compared C>G/A base edits in engrafting cells with input cells following two cycles of electroporation, n=3 independent healthy donors from input HSPCs, n=7 primary recipients for engrafted HSPCs, n=10 primary recipients for engrafted B cells and erythroid, n=11 primary recipients for engrafted BM. e, Human bone marrow chimerism 16 weeks after secondary transplantation. Donor 6 and donor 7 with 1 cycle EP and 2 cycles EP, and donor 8 with 2 cycles EP are shown. Data are plotted as grand median, n=6 secondary recipients from mock, n=5 secondary recipients from 1 EP, n=10 secondary recipients from 2 EP. f, Base editing by deep sequence analysis at C6 position in bone marrow 16 weeks after secondary transplantation. Data are plotted as median with range, n=2 secondary recipients from donor 6 with 1 EP, n=3 secondary recipients from donor 6 with 2 EP, n=2 secondary recipients from donor 7 with 1 EP, n=2 secondary recipients from donor 7 with 2 EP, n=5 secondary recipients from donor 8 with 2 EP. g, HbF induction by HPLC in engrafted bone marrow human erythroid cells. Data are plotted as grand median and analyzed using Kolmogorov-Smirnov test, **P=0.004, *** P=0.0002 HbF level in engrafted erythroid cells with 1 EP or 2 EP as compared to mock. *P=0.019 HbF level in engrafted erythroid cells with 2 EP as compared to 1 EP, n=6 primary recipients from mock, n=5 primary recipients from 1 EP, n=10 primary recipients from 2 EP. h, Correlation of base edit frequency and HbF level in engrafted erythroid cells. Data are analyzed using two-tailed nonparametric Spearman correlation. The Spearman correlation coefficient (r) is shown, P<0.0001. n=6 primary recipients from mock, n=5 primary recipients from 1 EP, n=10 primary recipients from 2 EP.

