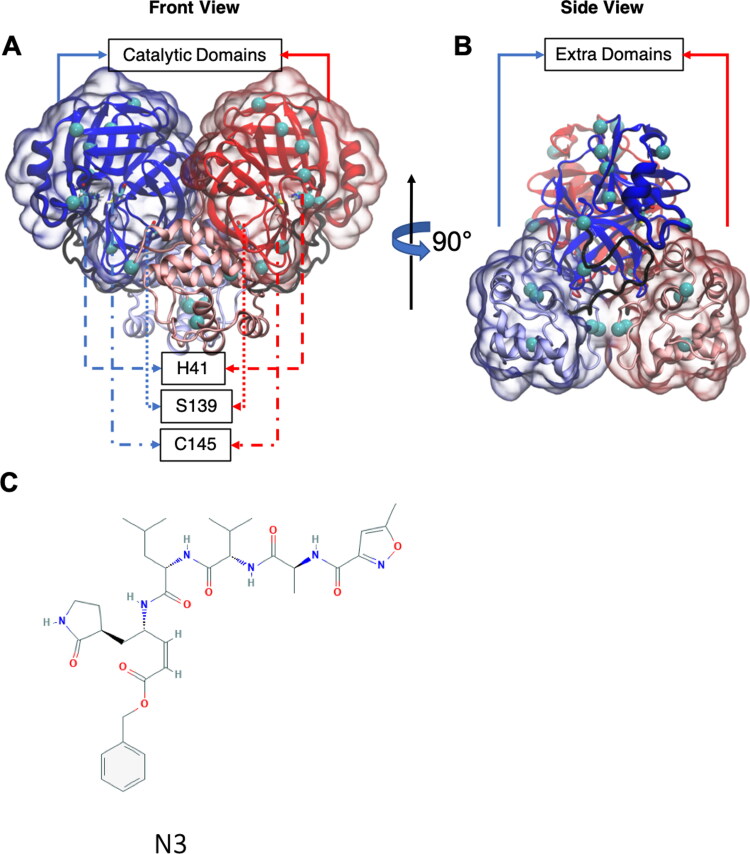
Figure 1.
SARS-CoV-2 Mpro given in New Cartoon representation. Coloring is according to chain IDs (or protomers): A, blue; B, red. Each protomer contains two major domains. Catalytic domain and extra domain were highlighted with transparent surface representation. The residues connecting the catalytic and extra domains is shown in black tube representation. Residue 139 and catalytic dyad residues (H41 and C145) are presented in Licorice representation. SARS-CoV Mpro differs from SARS-CoV-2 Mpro at the mutation sites highlighted as cyan VDW spheres. (A) Front view. (B) Side view. (C) 2D structure of N3. All protein visualizations were produced with VMD (Humphrey et al., 1996).

