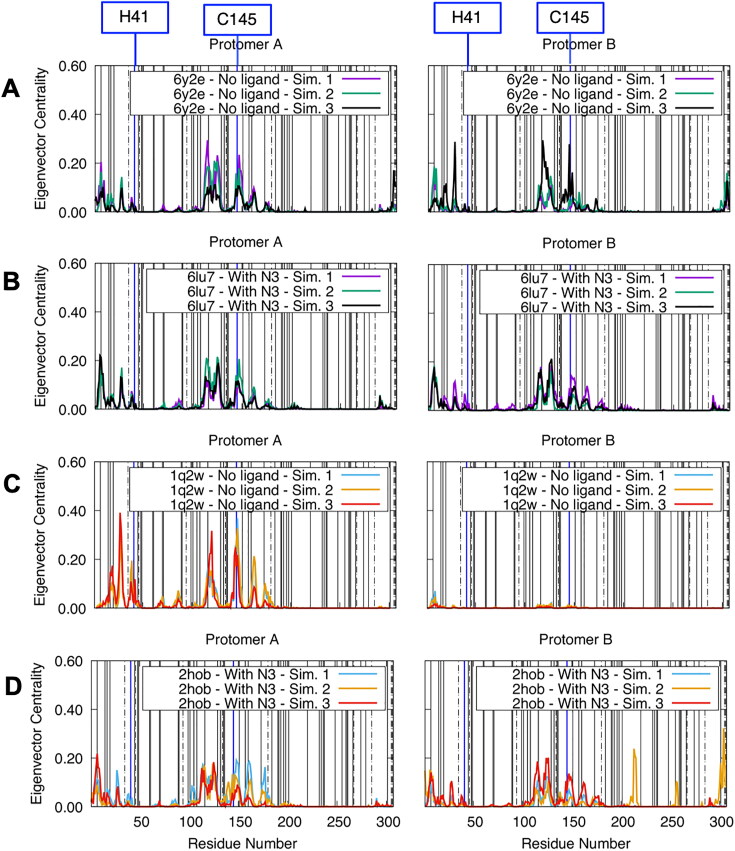
Figure 6.
Residue-wise eigenvector centralities of SARS-CoV and SARS-CoV-2 Mpro in only dimeric forms (left column: protomer A, right column: protomer B) with 7 Å distance threshold and 0.3 LMI value threshold. (A) SARS-CoV-2 Mpro apo state (PDB ID: 6y2e). (B) SARS-CoV-2 Mpro holo state (PDB ID: 6lu7). (C) SARS-CoV Mpro apo state (PDB ID: 1q2w). (D) SARS-CoV-2 Mpro holo state (PDB ID: 2hob). Solid vertical lines show locations of early mutations in GISAID database and a mutational analysis of dynamics study (Sheik Amamuddy, Verkhivker, et al., 2020). Locations of catalytic dyad residues were highlighted with blue vertical lines. Dot-dashed lines indicate locations of mutations between SARS-CoV and SARS-CoV-2 Mpro.

