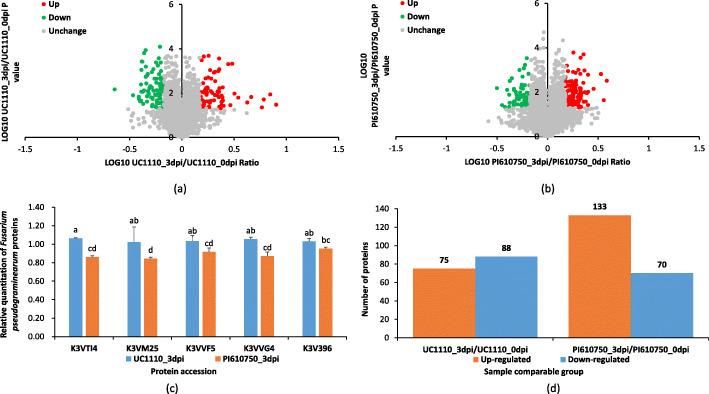
Fig. 3.
Differentially expressed proteins (DEPs) analysis between UC1110_3dpi/UC1110_0dpi and PI610750_3dpi/PI610750_0dpi. Volcano plot of all DEPs in UC1110_3dpi/UC1110_0dpi (a) and PI610750_3dpi/PI610750_0dpi (b); relative quantitation analysis of five marker proteins of F. pseudograminearum between UC1110_3dpi and PI610750_3dpi (c). Data are shown as mean ± SD (n = 3) of three independent experiments. Different lowercase letters (a or b) indicate significant differences between the groups (P < 0.05). K3VTI4: Members of the aldo keto reductase family; K3VM25: NF-X1 finger and helicase; K3VVF5: BHLH family transcription factor; K3VVG4: BHLH family transcription factor; K3V396: nucleoporin; quantitative analysis of the proteome between UC1110_3dpi/UC1110_0dpi and PI610750_3dpi/PI610750_0dpi (d). In blue (down-regulated): DEPs with t-test P < 0.05 and fold-change < 0.667; in orange (up-regulated): DEPs with t-test P < 0.05 and fold-change > 1.5

