
Extended Data Fig. 8 |. Plot of the fitted linear response of population at risk of hunger (million) to climate-induced crop yield change for different values of trade costs (1st decile, median, 9th decile).
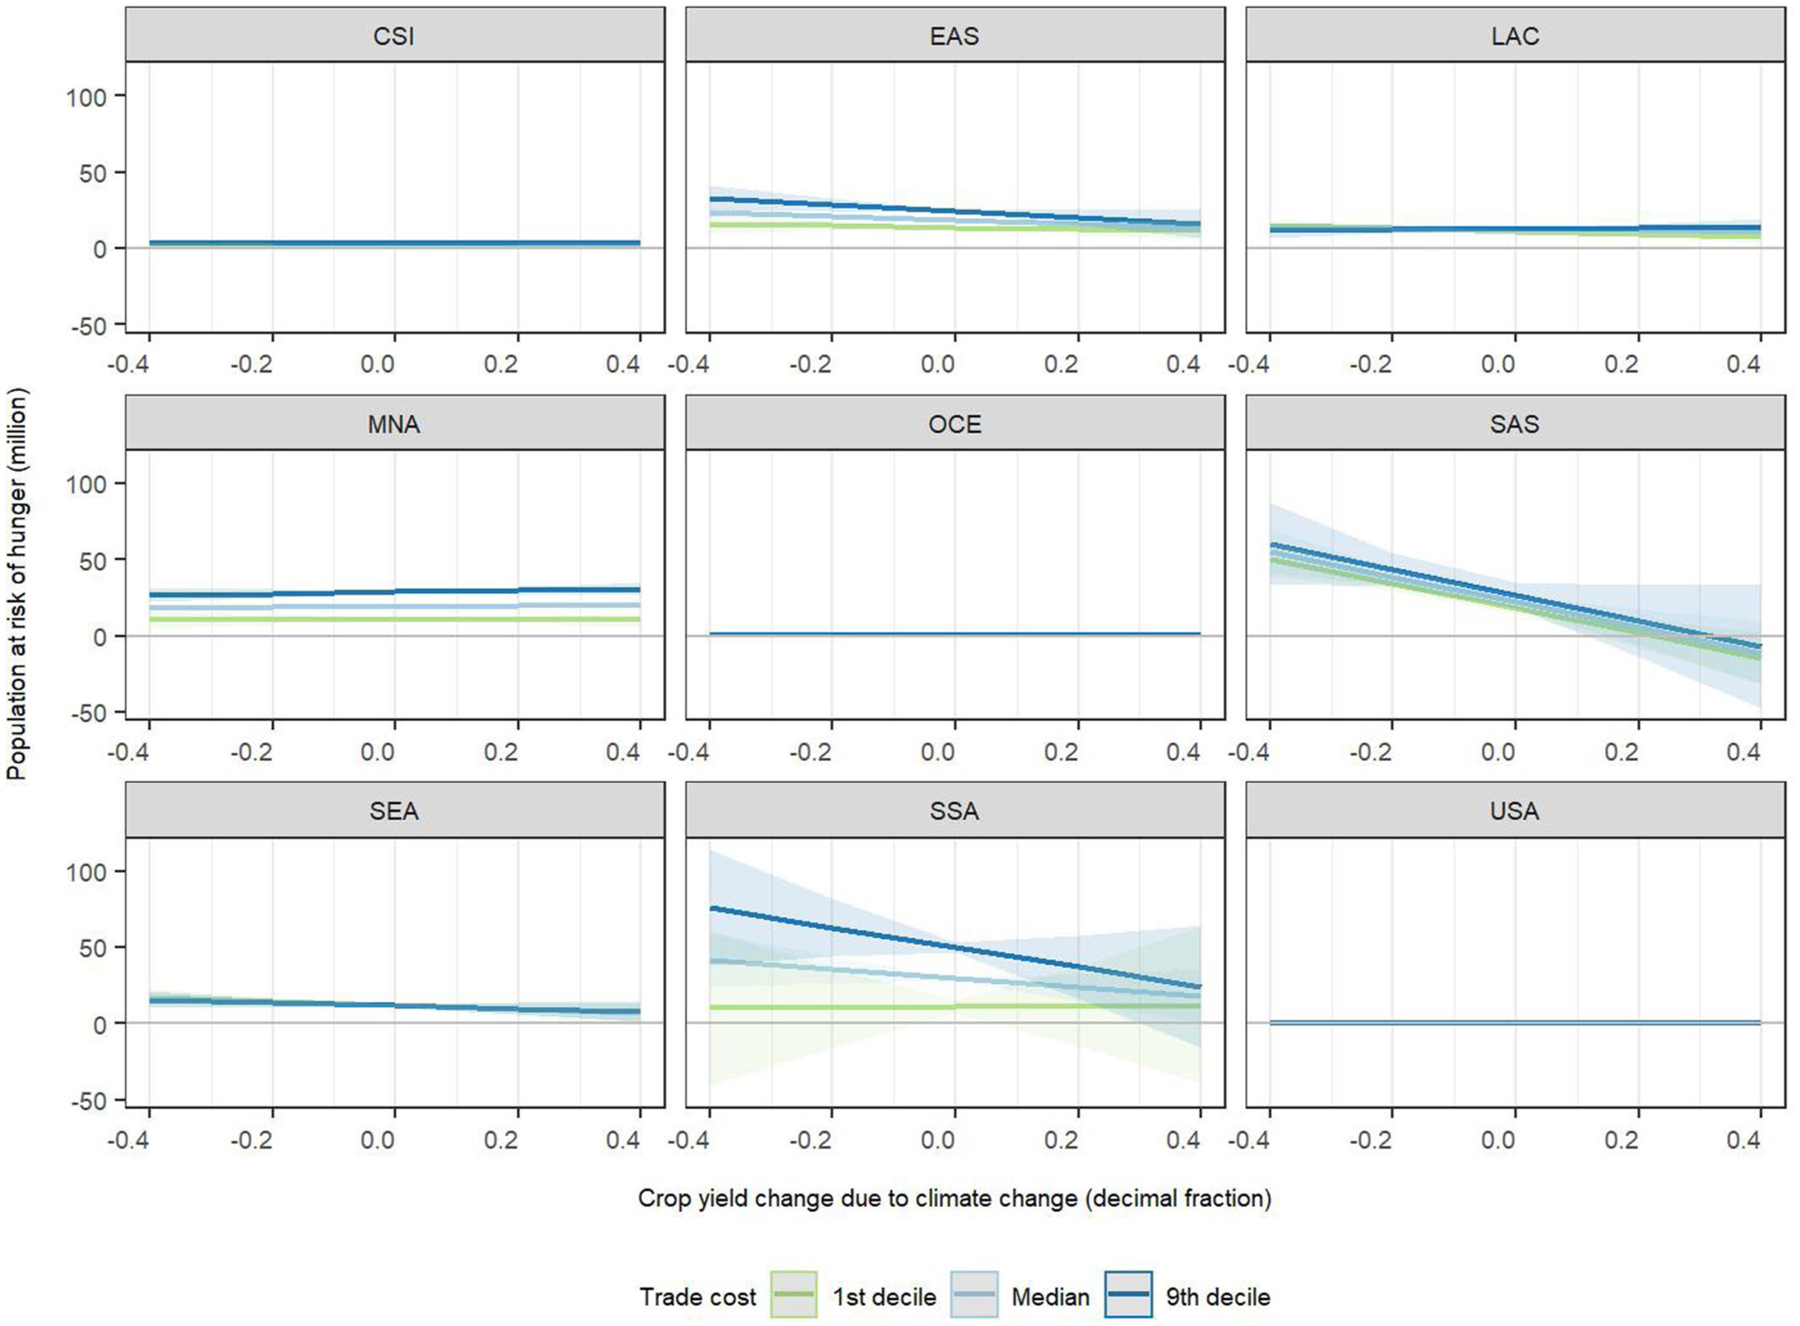
Shaded areas indicate prediction intervals. Prediction based on an OLS estimation of a regional level linear regression of the impact of crop yield change, trade costs and their interaction on population at risk of hunger. Regression results are shown in Supplementary Table 3 and the regression model is described in Method.