
Extended Data Fig. 1 |. Biophysical impact of climate change on average crop yield in each region by 2050 as projected by the EPIC crop model.
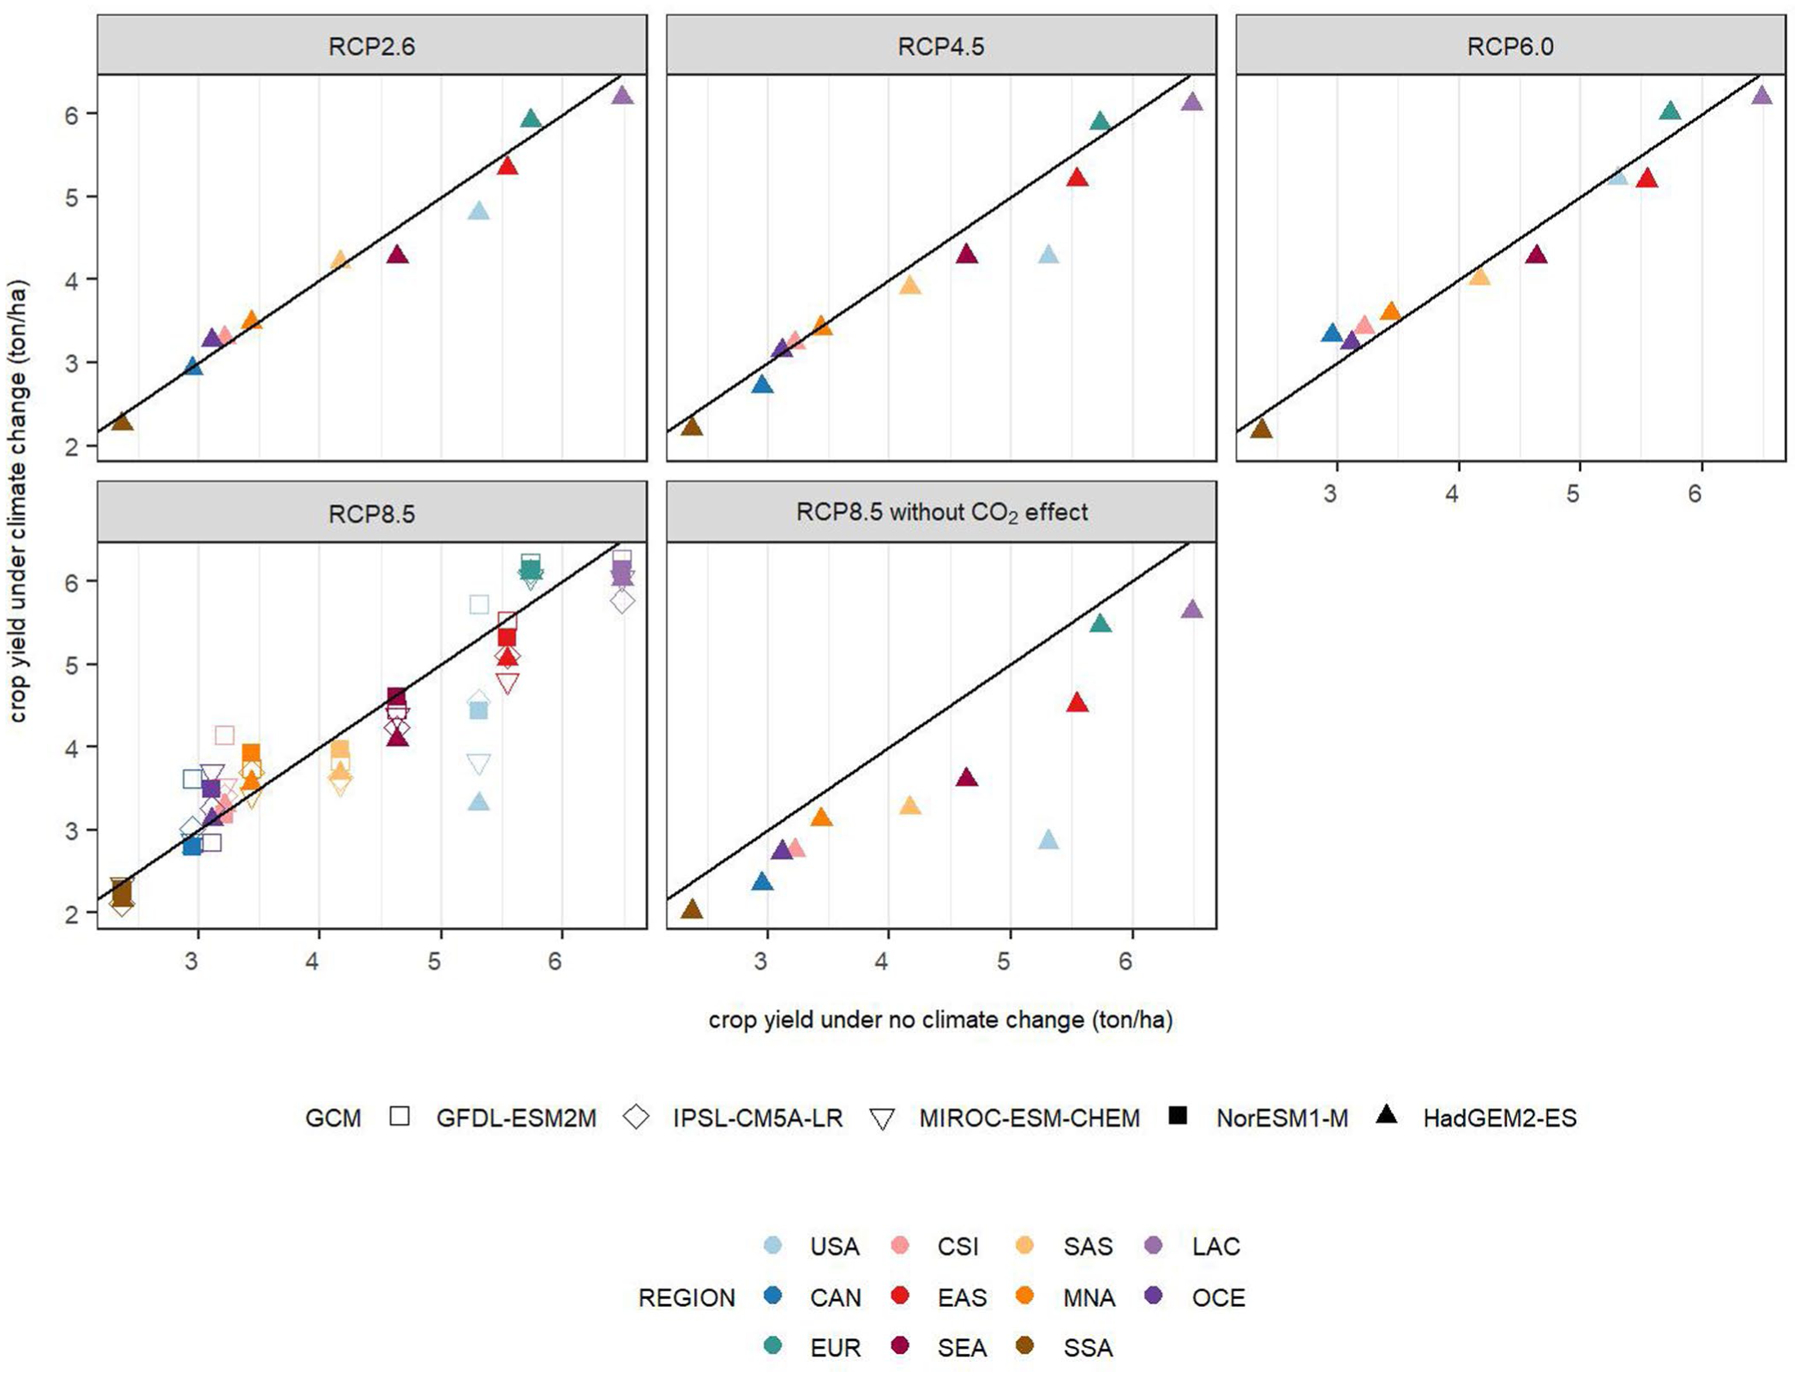
Yields in ton dry matter per ha. The x-axis indicates the crop yield under no climate change and y-axis the crop yield under climate change for different RCP × GCM combinations without market feedback and adaptation measures. Under no climate change yields are determined by base year yield and assumptions on technological development over time, under climate change an additional climate impact shifter is applied. Points above the black line indicate an increase in crop yield, points below a decrease in crop yield.