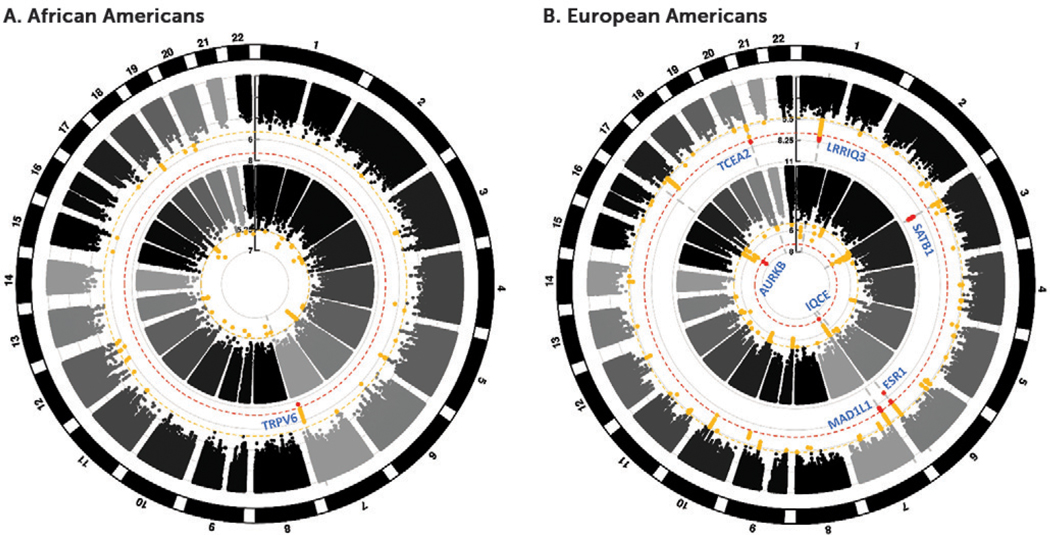
FIGURE 1. Circle Manhattan plot for anxiety phenotypes in African Americans and European Americansa.
a The outer circle displays results of the Generalized Anxiety Disorder 2-item scale genome-wide association study (GWAS), and the inner circle contains results for the case-control (self-report of physician diagnosis of anxiety disorder) GWAS. Numbers outside the circle represent chromosomes. Red dots indicate genome-wide significant findings (p<5 ×10⁻⁸) and yellow dots indicate suggestive findings (p<5×10⁻⁶). The scale on the y-axis represents −log10(p value). Vertical dashed gray lines are drawn through genome-wide significant findings to indicate overlap between analyses. The genes nearest to the lead SNP are labeled adjacent to the result. In most cases a genome-wide significant (red) locus from one phenotype overlaps with at least a suggestive (yellow) locus in the other.

