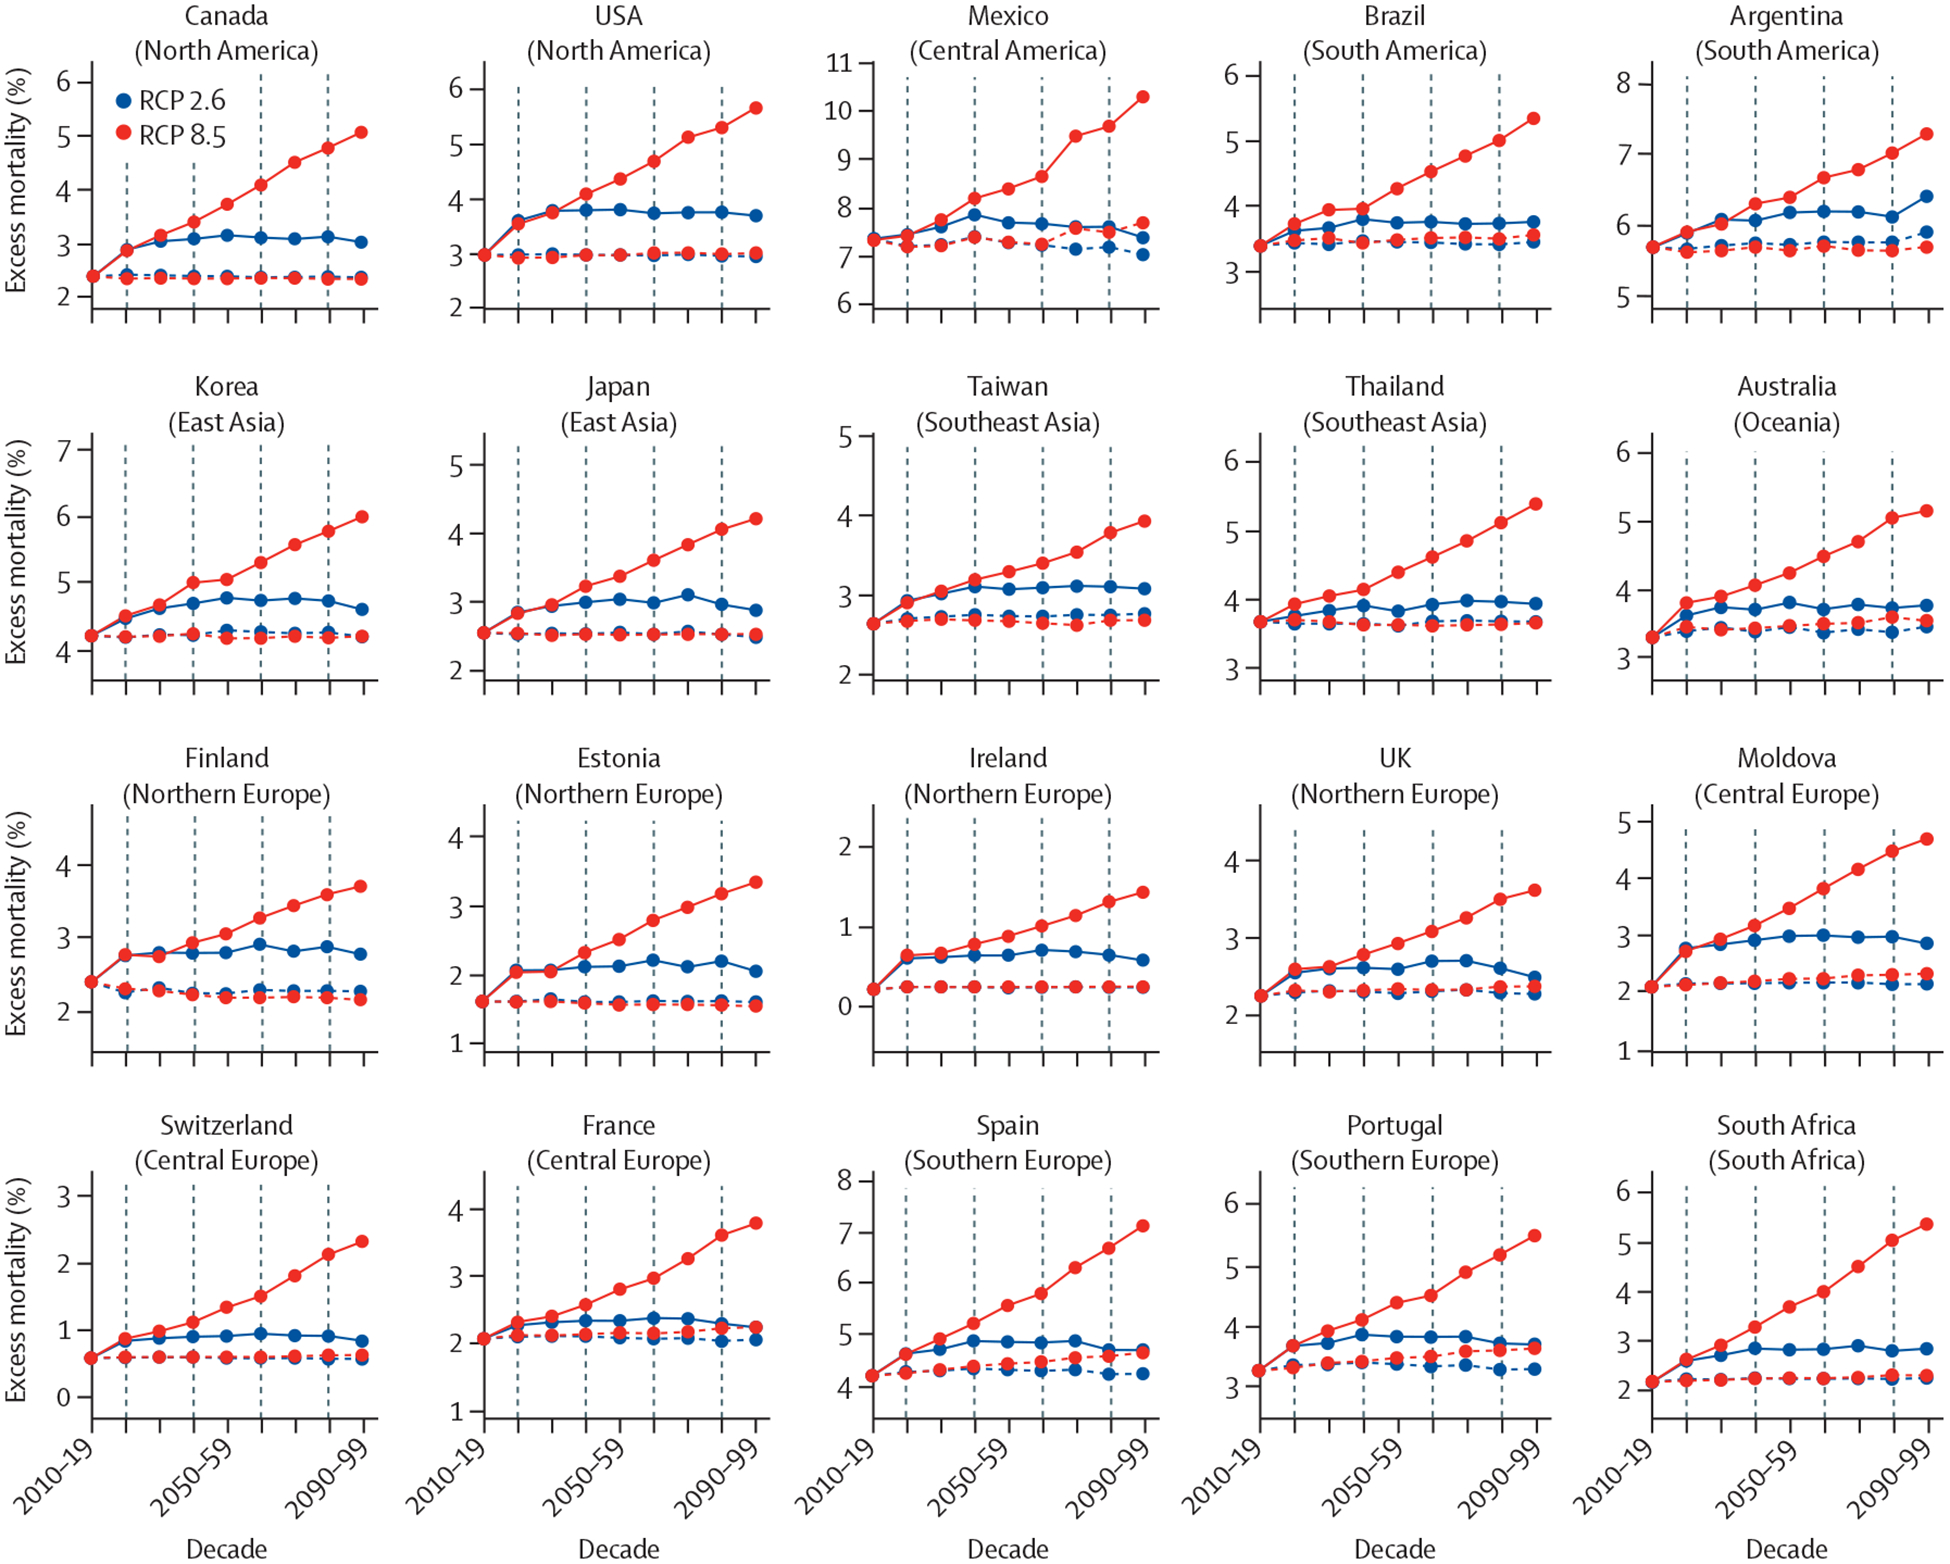
Figure 2: Excess mortality attributed to DTR by decade in 20 countries and regions for four climate change scenarios.

Solid lines indicate the estimates with an interactive effect with long-term average temperature on DTR-related mortality risk, and dashed lines represent estimates without. All countries are arranged in order of latitudes within each region. Estimates are reported as GCM-ensemble average decadal fractions. DTR=diurnal temperature range. RCP=representative concentration pathway. GCM=general circulation model.
