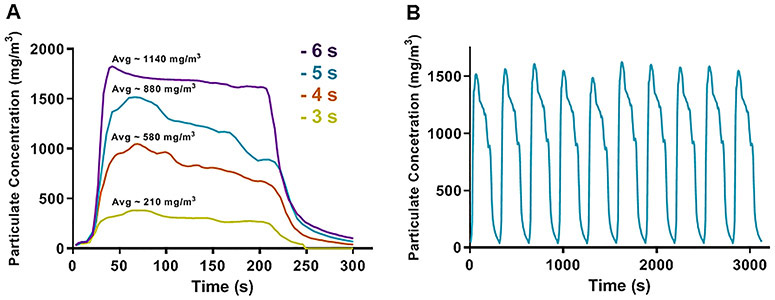
Figure 6. Particulate concentrations as a function of e-cig puff durations.
A, The profile from one exposure cycle is shown with 4 different puffing times of 3, 4, 5, or 6 s with 5 s mix, 180 s exposure, 120 s purge, and 5 s rest. Particulate was passed through a 1:4 ratio diluter and concentration was recorded every 3 s using a Dataram monitoring system. B, exposure profile pattern of 10 consecutive exposure cycles using 5 seconds puff time long with 5 s mix, 180 s exposure, 120 s purge, and 5 s rest between cycles.

