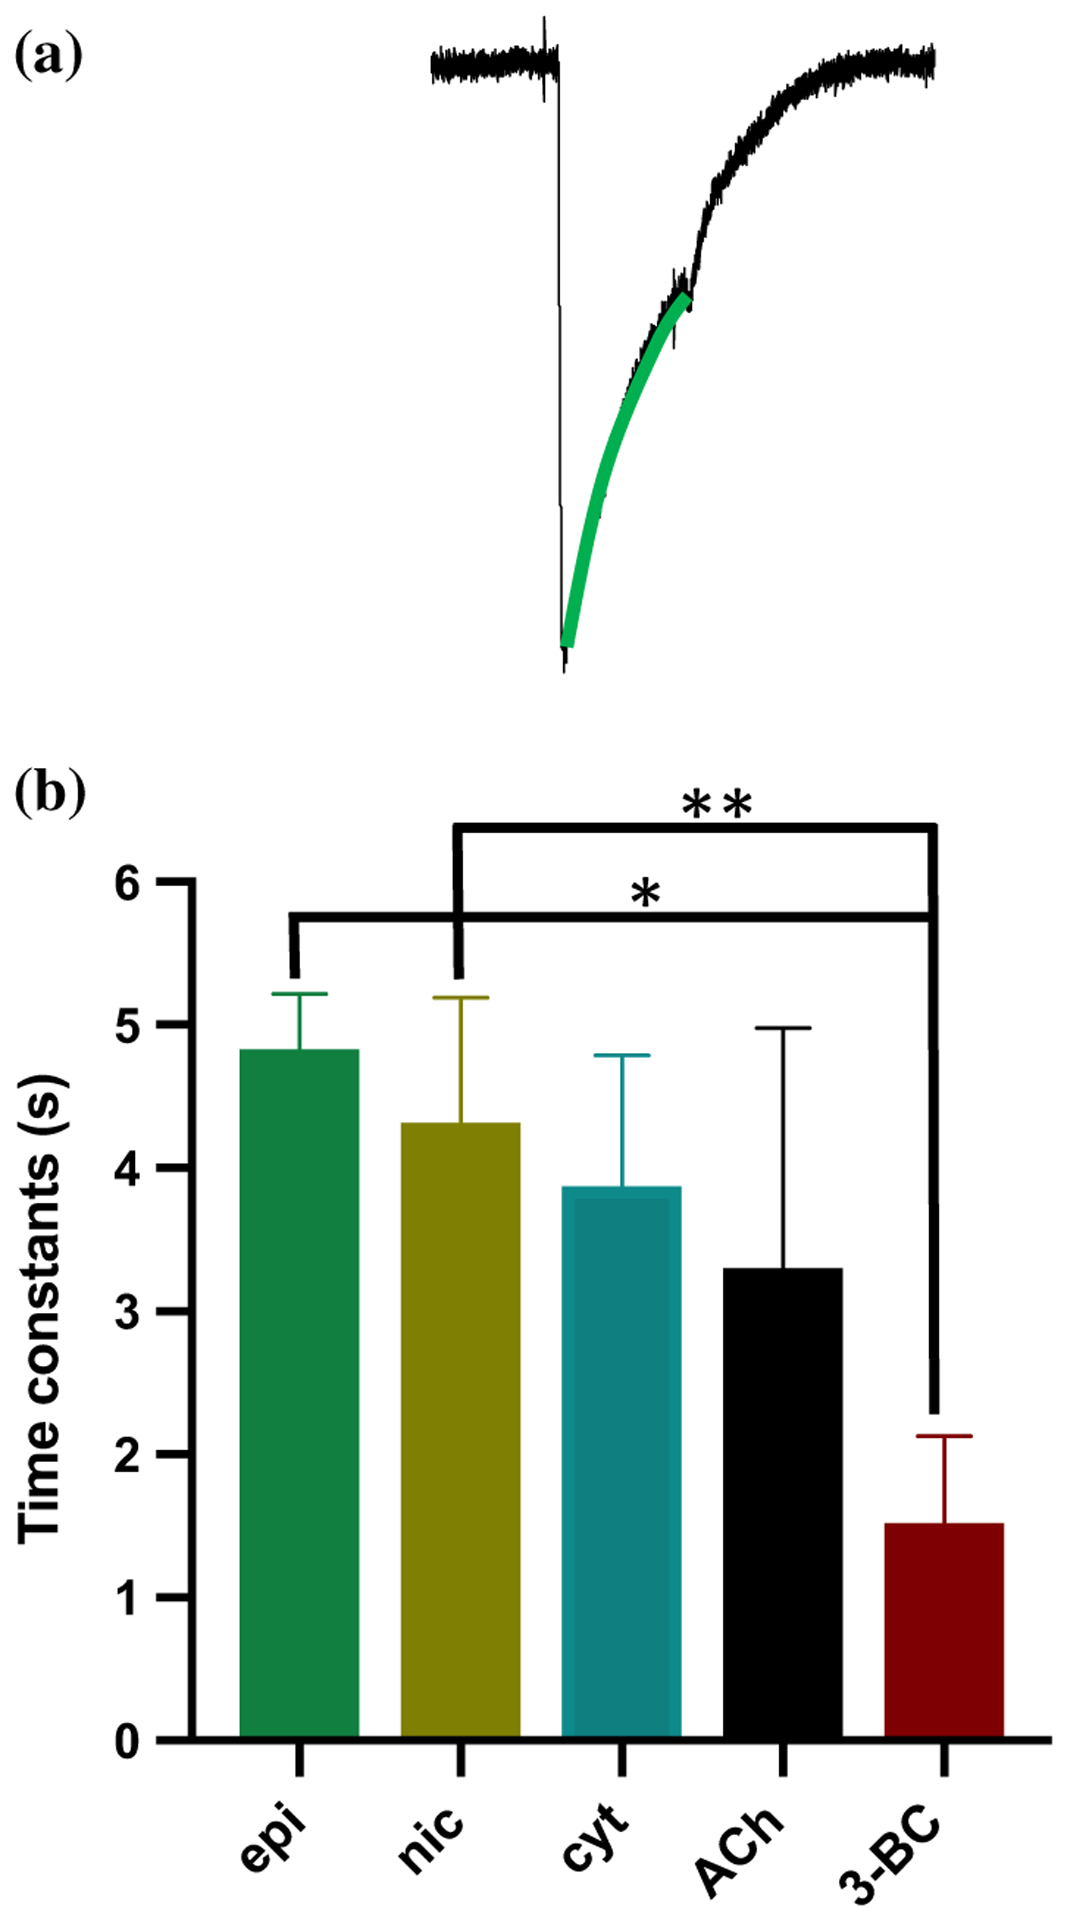
Fig. 4.

Aca-ACR-16 desensitization rate constant fit. a Sample trace of response to agonist with green line signifying the desensitization fit. b Bar graph showing desensitization time constants of the Ancylostoma caninum ACR-16 nAChR in response to agonists (100 μM, n = 4). The rank order of time constants of desensitization (mean ± SEM, s) was as follows: epi (4.8 ± 0.2) > nic (4.3 ± 0.5) > cyt (3.9 ± 0.5) > ACh (3.3 ± 1.0) > 3-BC (1.5 ± 0.3). *P < 0.05, **P < 0.01; significantly different as indicated; Tukey’s multiple comparison test
