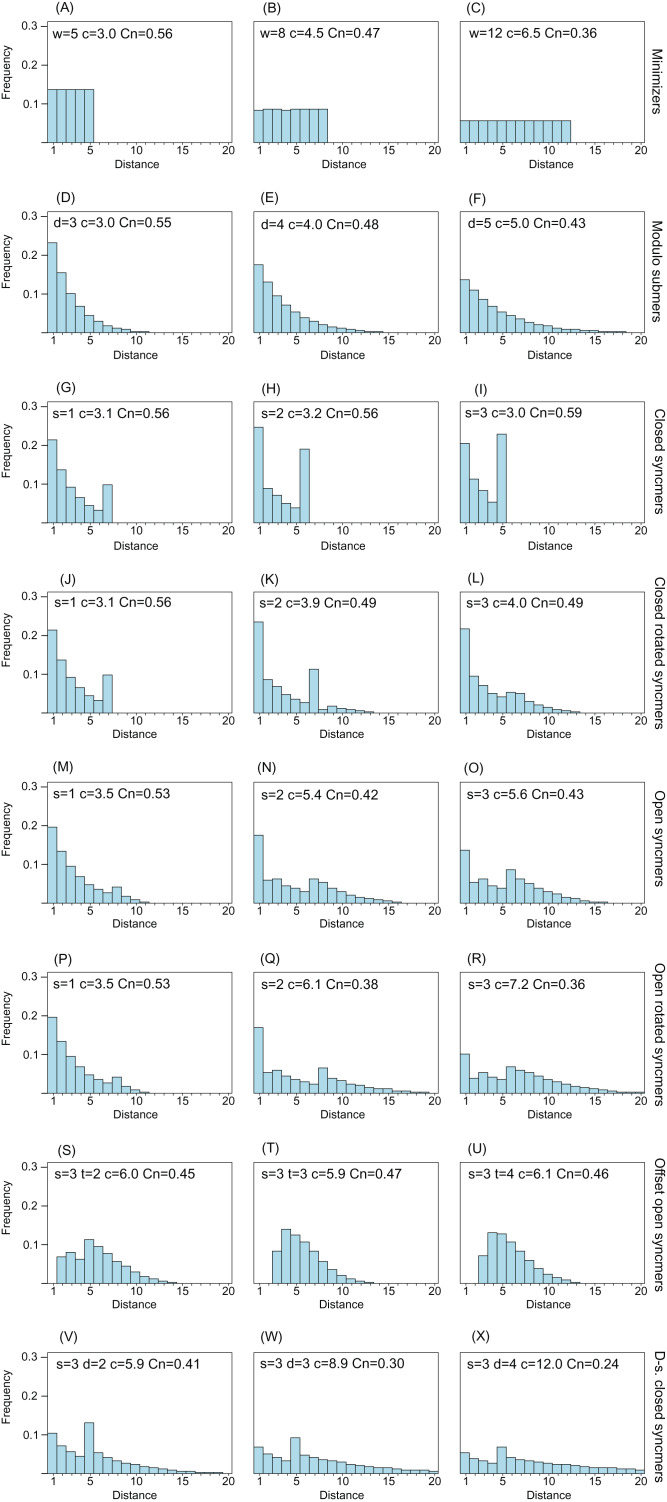
Figure 2. Frequency distribution of distances between consecutive submers.
The histograms show spacing distributions for some representative submer types with k = 8 including (A–C) minimizers, (D–F) modulo submers, (G–I) closed syncmers, (J–L) closed rotated syncmers, (M–O) open syncmers, (P–R) open rotated syncmers, (S–U) open syncmers with offset and (V–X) downsampled closed syncmers. Parameters, for example, s (sub-sequence length) and t (offset), are shown at the top of each chart, together with c (compression) and Cn (fraction of conserved letters at 90% identity) for every chart.

