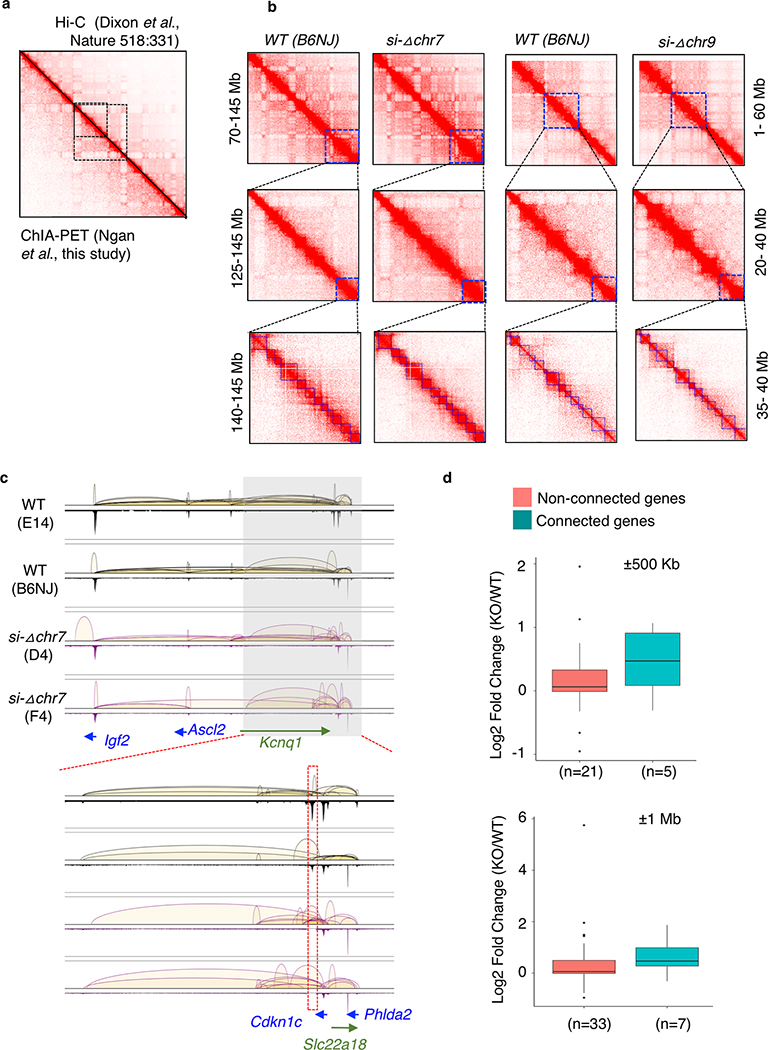
Extended Data Fig. 6: The loss of connectivity triggers genes reactivation.
a. Heatmap showing connectivity in previous study using Hi-C and current study using ChIA-PET. Example shown is chr1:36,282,810–192,258,731. b. Topological-associated domain analysis showed no difference in si-Δchr9, si-Δchr7 compared to wildtype. c. Loss of connecting loops in si-Δchr7 clones D4 and F4. Shown are chr7:142,557,623–14,3646,256 and zoom in region chr7:143,127,114–14,3550,277. d. Genes expression of connected of si-Δchr7 and non-connected genes from flanking 500kb and 1Mb regions. Only clone D4 is shown. n indicates number of genes in each category. See details in Supplementary Table 8B.

