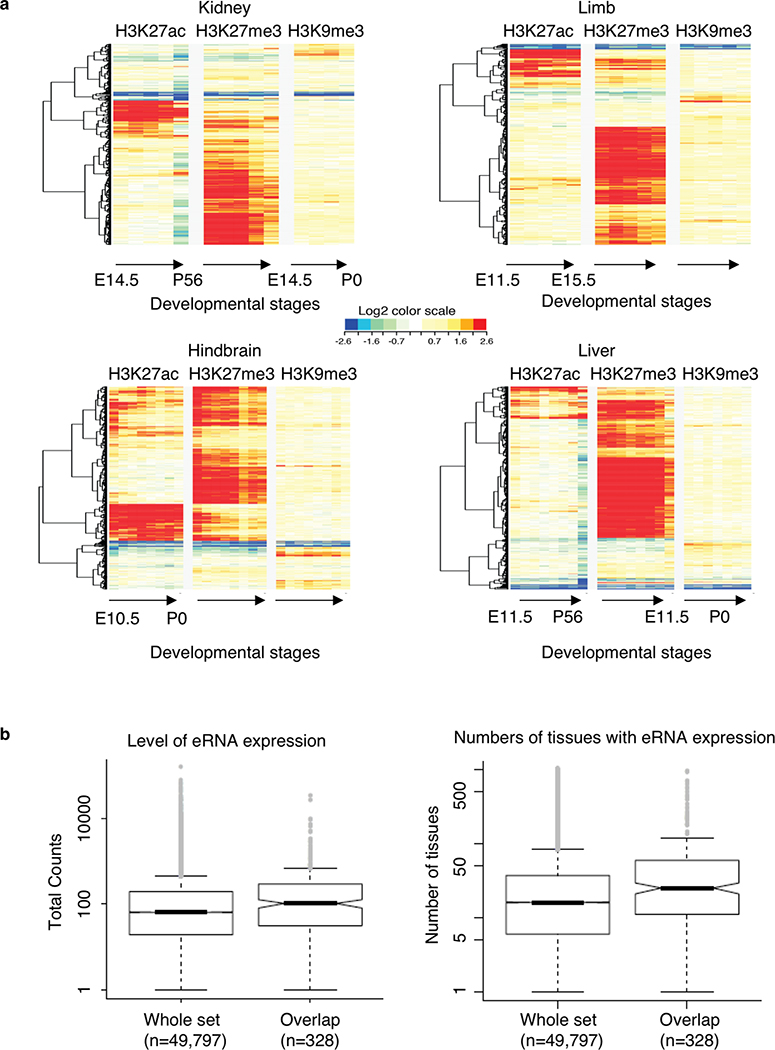
Extended Data Fig. 10: Features of intergenic anchors in developmental stages.
a. Heat maps H3K27me3, H3K27ac, H3K9me3 normalized signals of the 1,800 I-anchors through progressive developmental stages of kidney, limbs, hindbrain and liver. The color scales represented the fold enrichment of the ChIP vs input at log2 scale. b. Expression of eRNA in distal regulatory elements (DREs) and those overlapped with PRC2-bound silencers. Each box represents first quartile (bottom) and third quartile (top) with median in the middle. Whiskers represent data range defined as 1.5 times interquartile from median (Q2 +/− 1.5*(Q3-Q1)). Points above whiskers represent outliers.

