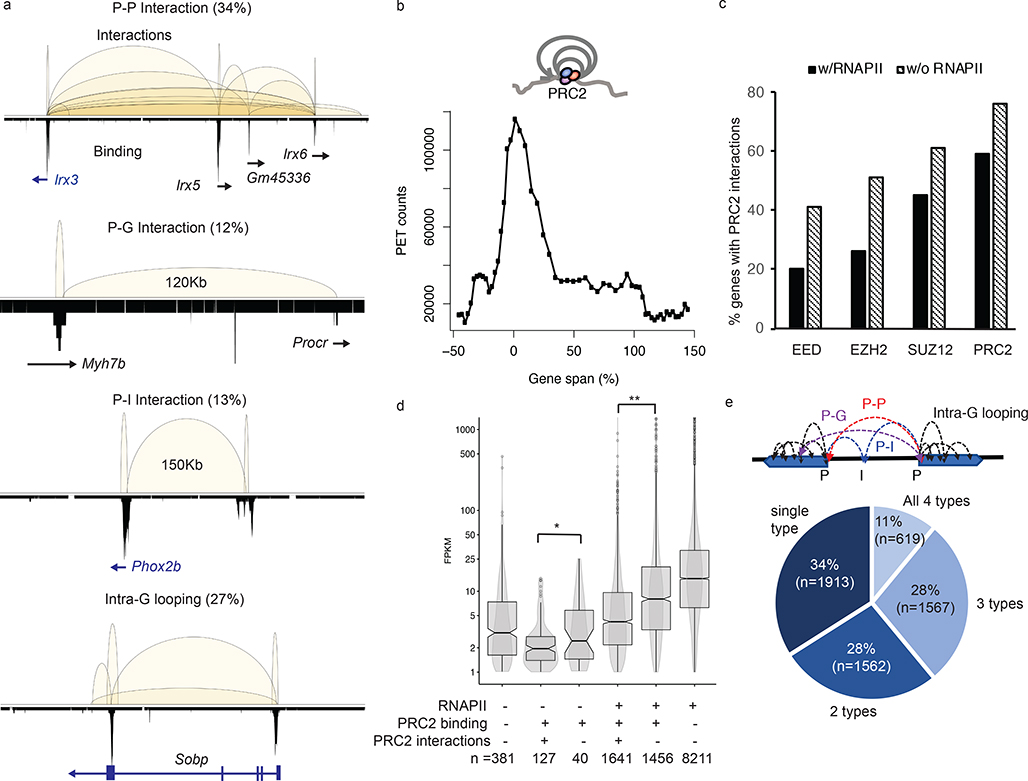
Fig. 2: PRC2 mediates extensive chromatin looping in genes of low transcription activities.
a. Four major subclasses of PRC2 interactions are classified based on features, gene (G), promoter (P) and intergenic (I), associated with the interaction anchors. The chromosomal regions showed are as follows; P-P, chr8:91,651,961–92,862,573; P-G, chr2:155,604,301–155,765,282; P-I, chr5:66,963,794–67,352,967 and Intra-G looping, chr10:42,916,485–43,260,546. PRC2 binding profiles are shown in lower tracks. b. The distribution of interaction frequency (PET counts) across the gene coding regions associated with PRC2 intra-G looping (n = 3,483). c. The percentages of genes with PRC2 interactions detected. X-axis indicates the protein factors bound at the promoters. Significant differences (paired t-test, p = 0.0012) are found between binding in the presence (black) or absence (hatched) of RNAPII. d. Distribution of steady-state RNA expression level (FPKM) among genes with different patterns of binding and interactions. Each box represents first quartile (bottom) and third quartile (top) with median in the middle. Whiskers represent data range defined as 1.5 times interquartile from median (Q2 +/− 1.5*(Q3-Q1)). Points above whiskers represent outliers. The single and double asterisks indicate significant p-value = 0.034 and 2.2E-16 from one-sided Wilcoxon rank sum tests.
e. The percentages of PRC2 tethered genes with single, dual, three or all four subclasses of interaction types. Most genes are associated with more than one category of interactions.

