

SUMMARY
During vesicular acidification, chloride (Cl−), as the counterion, provides the electrical shunt for proton pumping by the vacuolar H+ ATPase. Intracellular CLC transporters mediate Cl− influx to the endolysosomes through their 2Cl−/H+ exchange activity. However, whole-endolysosomal patch-clamp recording also revealed a mysterious conductance releasing Cl− from the lumen. It remains unknown whether CLCs or other Cl− channels are responsible for this activity. Here, we show that the newly identified proton-activated Cl− (PAC) channel traffics from the plasma membrane to endosomes via the classical YxxL motif. PAC deletion abolishes the endosomal Cl− conductance, raises luminal Cl− level, lowers luminal pH, and increases transferrin receptor-mediated endocytosis. PAC overexpression generates a large endosomal Cl− current with properties similar to those of endogenous conductance, hypo-acidifies endosomal pH, and reduces transferrin uptake. We propose that the endosomal Cl− PAC channel functions as a low pH sensor and prevents hyper-acidification by releasing Cl− from the lumen.
Graphical Abstract

In Brief
Osei-Owusu et al. show that the recently identified proton-activated chloride (PAC) channel traffics from the plasma membrane to endosomes and forms an intracellular organelle Cl− channel. PAC functions as a low pH sensor in endosomes and prevents luminal hyper-acidification.
INTRODUCTION
Endosomal acidification is central to receptor and ligand sorting, trafficking, recycling, and degradation (Maxfield and McGraw, 2004). The acidification process is generated by the electrogenic vacuolar H+ ATPase (V-ATPase), pumping protons into the endosomal lumen (Mellman et al., 1986). Chloride (Cl−) is known to be one of the principal counterions responsible for shunting the luminal positive membrane potential produced by proton pumping. CLC family exchangers (CLC3–5) mediate the accumulation of Cl− in the endosomal lumen, neutralizing the positive charge gradient through their 2Cl−/H+ exchange activity (Mindell, 2012; Stauber and Jentsch, 2013). However, whole-organelle electrophysiological recording with acidic pipette solution has also revealed a Cl− current from the endolysosomes of various cell types allowing Cl− to move unidirectionally from the lumen to the cytosol (outwardly rectifying) (Cang et al., 2014). Because the rate of ion exchange through the transporters is relatively slow, this endogenous Cl− conductance is unlikely to be mediated by the CLCs. It suggests the existence of other Cl− channels, potentially leaking Cl− from the endosomal lumen and regulating Cl− concentration by antagonizing the well-established CLC exchangers. However, the molecular identity and functional role of this Cl− conductance in maintaining endosomal pH homeostasis have remained unknown.
Opened by extracellular acidic pH, the proton-activated Cl− (PAC) channel has been observed in a wide range of cells and tissues by whole-cell patch-clamp recording (Capurro et al., 2015). It exhibits a strong outwardly rectifying current-voltage (I–V) relationship, also referred to as PAORAC (proton-activated outwardly rectifying anion channel) (Lambert and Oberwinkler, 2005) or ASOR (acid-sensitive outwardly rectifying anion channel) (Wang et al., 2007). The molecular identity of PAC has been a mystery for 2 decades. Through a cell-based fluorescence reporter assay and an unbiased RNA interference screen, we recently identified a gene PACC1 (also known as TMEM206) encoding the PAC channel (Yang et al., 2019). Tissue acidosis is one of the pathological hallmarks of many diseases, including ischemia, cancer, and inflammation. By mediating Cl− influx and subsequent cell swelling, the PAC channel has been implicated in acid-induced cell death (Wang et al., 2007). Indeed, we showed that knockout (KO) or knockdown of PAC partially protects cells from acid-induced cell death and attenuates brain damage after ischemic stroke in mice (Osei-Owusu et al., 2020; Yang et al., 2019). Using a similar unbiased approach, another independent study also identified PAC (TMEM206) protein as the PAORAC/ASOR PAC channel (Ullrich et al., 2019). The two-transmembrane PAC protein is highly conserved across vertebrate species. It shares no obvious sequence similarity with other membrane proteins, thus representing a different family of ion channels (Ullrich et al., 2019; Yang et al., 2019). Using single-particle cryo-electron microscopy (cryo-EM), we recently determined human PAC structures and revealed the trimeric channel assembly, ion-conducting pathway, and some pH-induced conformational changes of this ion channel (Ruan et al., 2020).
The threshold for PAC activation is relatively low: ~pH 5.5 at room temperature and ~pH 6.0 at 37°C (Sato-Numata et al., 2013; Yang et al., 2019). It is too acidic to be found under the majority of physiological conditions. However, the intracellular endocytic and secretory pathways, which have a luminal pH of 4.5–6.5 (Mindell, 2012; Stauber and Jentsch, 2013), may provide an ideal environment for PAC activation. In addition to its pathological role in acidosis, the conservation and broad tissue expression profile of PAC suggest that it may also play an important housekeeping function. In this study, we discovered that the PAC channel, initially identified as a cell-surface channel by whole-cell recording, traffics from the plasma membrane to early and recycling endosomes via the classical YxxL motif. It encodes a bona fide acid-sensitive Cl− leak channel in endosomes and regulates endosomal pH, Cl− level, and transferrin-receptor-mediated endocytosis. PAC represents a Cl− conducting pathway in endosomes that serves to balance the activity of the well-characterized CLC exchangers.
RESULTS
PAC is localized to the early and recycling endosomes
To examine the subcellular localization of PAC, we first generated a tetracycline-inducible HEK293 stable cell line and expressed a low level of human PAC with a C-terminal FLAG tag (PAC-FLAGC) (Figures S1A and S1B). Although PAC activity in the plasma membrane was observed by whole-cell patch-clamp recording (Yang et al., 2019), FLAG immunofluorescence surprisingly revealed a prominent intracellular vesicle staining with relatively weak signals on the cell surface (Figure S1C). Because PAC is activated by acidic pH, we performed co-immunostaining with several markers along the endolysosomal pathway to identify the nature of the vesicles. PAC primarily colocalized with EEA1 and transferrin, markers of the early and recycling endosomes, respectively (Figures S1C and S1D). Notably, we observed minimal or absent colocalization with the lysosomal marker LAMP1 (Figures S1C and S1D). To exclude the possibility of overexpression artifact, we purified human PAC protein (Ruan et al., 2020) and generated a mouse monoclonal antibody using the conventional hybridoma method. We first validated the specificity of this antibody with western blot on protein lysates from wild-type (WT) and PAC KO HEK293T cells (Figure 1A). Using this antibody, we again observed predominant vesicular localization of endogenous PAC in HEK293T cells with weak signals on the plasma membrane (Figure 1B). The endogenous PAC was also mainly colocalized with EEA1 and transferrin, but not LAMP1, confirming its intracellular localization to early and recycling endosomes (Figures 1C and 1D). Since the presence of PAC in the plasma membrane is evident based on whole-cell recording, our immunofluorescence data suggest that PAC actively traffics from the cell surface to endosomes.
Figure 1. PAC is localized to the early and recycling endosomes via the classic YxxL trafficking motif.
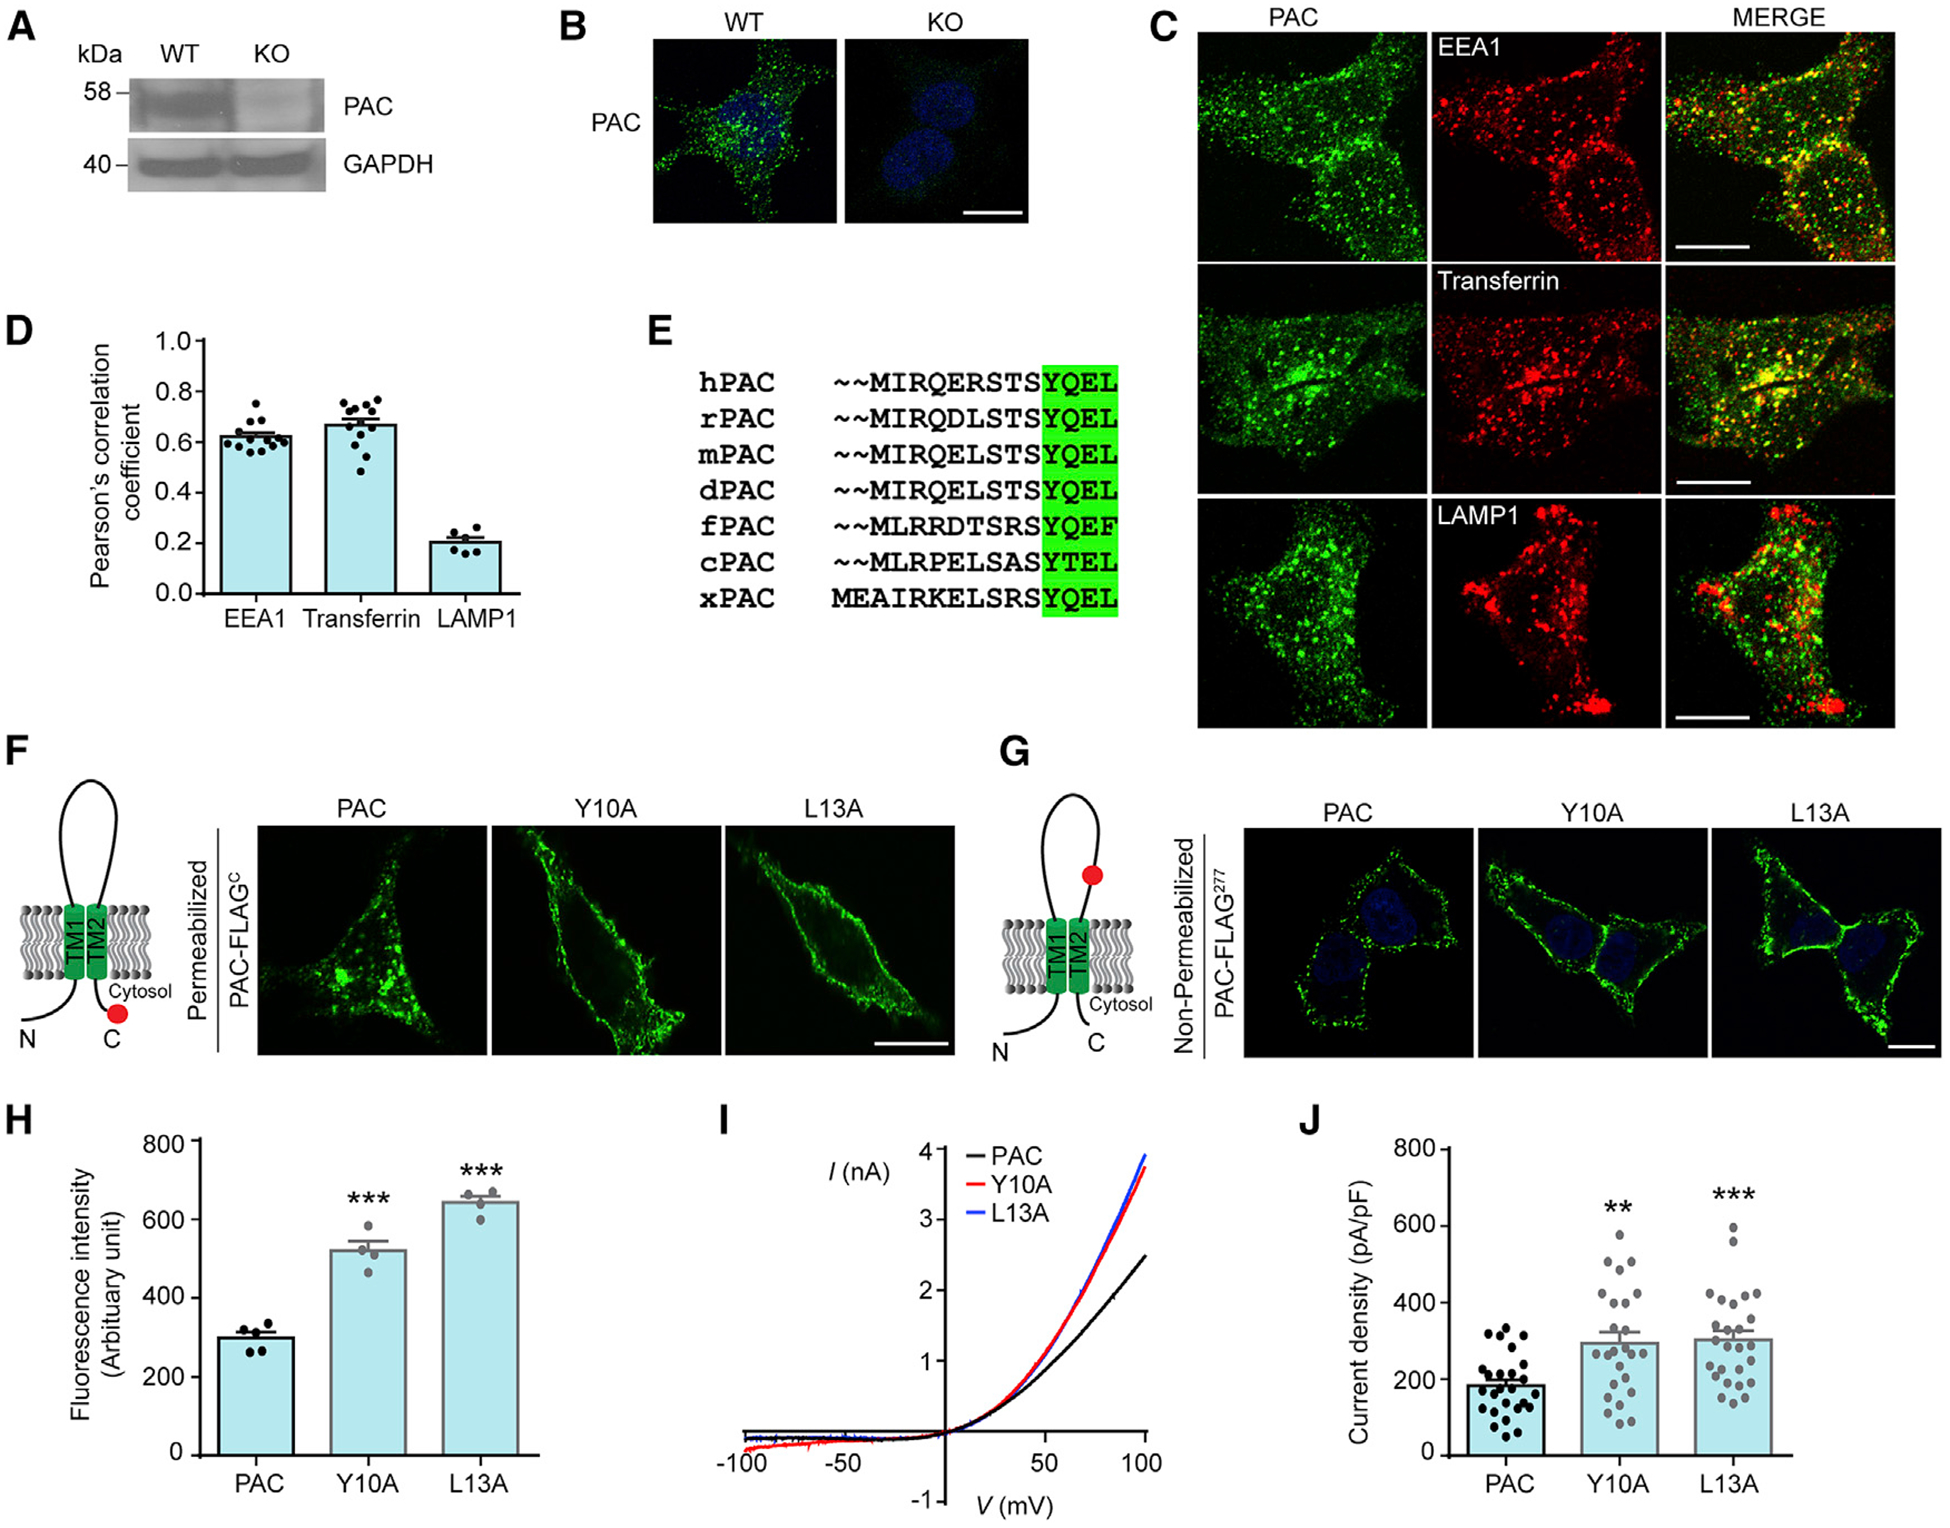
(A) Validation of PAC antibody by western blot analysis using WT and PAC KO HEK293T cell lysates.
(B) Immunostaining of endogenous PAC (green) and DAPI (blue) in WT and KO HEK293T cells. Scale bar, 10 μm.
(C and D) Immunostaining (C) and quantification (D) of PAC with endolysosomal markers showing that PAC colocalizes with EEA1 and transferrin. Scale bars, 10 μm. Error bars in (D) represent mean ± SEM. EEA1, n = 13 cells; transferrin, n = 13 cells; and LAMP1, n = 6 cells.
(E) Sequence alignment of PAC from different vertebrate animals showing a conserved YxxL motif in the N terminus. UniProt protein sequences shown here are from human (hPAC), rat (rPAC), mouse (mPAC), dog (dPAC), zebrafish (fPAC), chicken (cPAC), and frog (xPAC).
(F) Left: schematic representation of PAC-FLAGC showing FLAG tag (red) at the C terminus. Right: immunostaining of low-tetracycline-induced PAC-FLAGC WT-, Y10A-, and L13A-overexpressing stable cells. The cells were permeabilized to allow intracellular access to FLAG antibody. Scale bar, 10 μm.
(G) Left: schematic representation of PAC-FLAG277 showing FLAG tag (red) at position 277 of the extracellular domain. Right: immunostaining of low-tetracycline-induced PAC-FLAG277 WT-, Y10A-, and L13A-overexpressing stable cells. The cells were not permeabilized to allow only plasma membrane staining of PAC-FLAG277. Scale bar, 10 μm.
(H) Fluorescence intensity of (G) measured by flow cytometry analysis of ~10,000 cells per each biological replicate n (mean ± SEM; n = 4–5). ***p < 0.0001, one-way analysis of variance (ANOVA) with Bonferroni post hoc test.
(I) pH 5.0-induced PAC currents monitored by voltage-ramp protocol in HEK293 stable cells expressing PAC-FLAGC WT, Y10A, and L13A.
(J) Current density of (I) at +100 mV (mean ± SEM; n = 25–26 cells). **p < 0.01; ***p < 0.001, one-way ANOVA with Bonferroni post hoc test.
See also Figure S1.
PAC traffics to endosomes via the classical YxxL motif
To identify the mechanism of its endocytosis, we analyzed PAC amino acid sequences across different species and identified a conserved Yxxφ sequence motif (Y = tyrosine; x = any amino acid; and φ = hydrophobic residues, such as leucine [L] or phenylalanine [F]) (Figure 1E). YXXφ is a canonical endosomal targeting sequence that is recognized by the AP2 adaptor complex to facilitate receptor-mediated endocytosis (Traub and Bonifacino, 2013). To test whether the YxxL motif is required for PAC endocytosis, we substituted Y or L with alanine (A) and generated inducible HEK293 stable cell lines expressing human PAC with FLAG tag at the C terminus (in the cytosol, PAC-FLAGC) or at position 277 (in the extracellular loop, PAC-FLAG277). The total expression levels of WT and mutant proteins were similar (Figure S1E). However, compared to the endosomal localization of WT PAC-FLAGC, Y10A and L13A mutants showed much reduced vesicular staining with stronger cell-surface signals (Figure 1F), indicating defects in PAC endocytosis. We then performed live labeling experiments (non-permeabilized) on stable cells expressing PAC-FLAG277, which only allows access to the cell-surface FLAG epitope (Figure 1G). As predicted, cells expressing Y10A and L13A mutants exhibited stronger plasma membrane signals than those expressing WT PAC (Figure 1G). The difference in fluorescence intensity was further quantified by flow cytometry (Figure 1H). To determine whether increased cell-surface PAC boosts the PAC currents, we performed whole-cell recording. Consistently, we observed increased PAC currents in cells expressing Y10A and L13A mutants compared to those expressing WT PAC (Figures 1I and 1J). The increases in whole-cell current density of the trafficking mutants (Figure 1J) are not as dramatic as the enhancement of cell-surface fluorescence intensity (Figure 1H), suggesting that not all of the overexpressed proteins form functional ion channels. Together, these results demonstrate that PAC traffics from the plasma membrane to endosomes in the canonical YxxL-motif-dependent manner.
PAC is an endosomal Cl− channel
A Cl− conductance was previously observed in the endolysosomal membranes, which has features similar to those of the PAC current recorded on the plasma membrane, including acid sensitivity, steep outward rectification, and time-dependent facilitation at positive voltages (Cang et al., 2014). To record this Cl− current, we enlarged the endosomes by transiently transfecting HEK293T cells with Rab5-Q79L (Stenmark et al., 1994) (Figure 2A) and performed whole-endosome patch-clamp recording (Chen et al., 2017). Indeed, we observed an outwardly rectifying Cl− current in endosomes with acidic solution (pH 5.5) in the pipette (Figures 2B and 2F). When the pipette Cl− concentration was reduced from 150 mM to 1 mM, no current was recorded (Figures 2C and 2F), indicating a unidirectional flow of Cl− from the lumen to the cytosol. Increasing the pH of the pipette solution from acidic 5.5 to neutral 7.2 also abolished the current (Figures 2D and 2F), suggesting that this endosomal Cl− channel is gated by acid. These electrophysiological properties were similar to those of the endolysosomal Cl− conductance reported previously (Cang et al., 2014). They also resembled those of the PAC current recorded on the plasma membrane (Yang et al., 2019). To test whether the acid-sensitive endosomal Cl− conductance is mediated by PAC, we carried out whole-endosome recording in PAC KO cells. Pipette solution with a pH of 5.5 did not elicit any Cl− current in the endosomes of KO cells (Figures 2E and 2F), indicating that PAC is necessary for the acid-sensitive endosomal Cl− conductance. To test whether PAC is sufficient to mediate the endosomal current, we transiently overexpressed PAC cDNA in PAC KO cells and performed whole-endosome recording. Acidic pipette solution evoked robust current several times larger than the endogenous current, with similar electrophysiological properties, including time-dependent facilitation at positive voltages and strong outward rectification (Figures 3A and 3D). Furthermore, when luminal Cl− concentration was reduced from 150 mM to 1 mM, the Cl− current was abolished (Figures 3B and 3D), indicating that the PAC channel mediates an outward flow of Cl− from lumen to cytosol. Neutral pH-7.2 pipette solution also failed to elicit the endosomal PAC current (Figures 3C and 3D). These results demonstrate that PAC is an endosomal Cl− channel that is responsible for the mysterious acid-sensitive Cl− conductance previously recorded in endosomes.
Figure 2. PAC is required for an acid-sensitive Cl− conductance in endosomes.

(A) Diagrams illustrating the technique and nomenclature used in whole-endosome recording. Top: endosomes are enlarged by transiently transfecting HEK293T cells with mCherry-tagged Rab5-Q79L, which is colocalized with endogenous PAC. Scale bar, 5 μm. Bottom: enlarged endosomes are individually released from Rab5-Q79L-transfected cells ruptured by a glass pipette and are subject to whole-endosome recording (Chen et al., 2017). Δψ is the electrical potential across the endosomal membrane, with lumen used as the reference (Bertl et al., 1992; Cang et al., 2015). Outward currents are plotted as positive values, representing the movement of negative charges (Cl−) out of the endosomal lumen into the topological space equivalent to cytosol (bath).
(B–D) Acid-sensitive currents monitored by voltage-ramp (left) and voltage-step (right) protocols in WT endosomes: (B) (pH 5.5) 150 mM luminal and cytosolic Cl−; (C) (pH 5.5) 1 mM luminal and 150 mM cytosolic Cl−; and (D) (pH 7.2) 150 mM luminal and cytosolic Cl−.
(E) Acid-sensitive currents monitored by voltage-ramp (left) and voltage-step (right) protocols in PAC KO endosomes (pH 5.5; 150 mM luminal and cytosolic Cl−).
(F) Current amplitudes of (B)–(E) at +100 mV. Error bars represent mean ± SEM.
Figure 3. PAC recapitulates the properties of the endogenous endosomal Cl− channel.
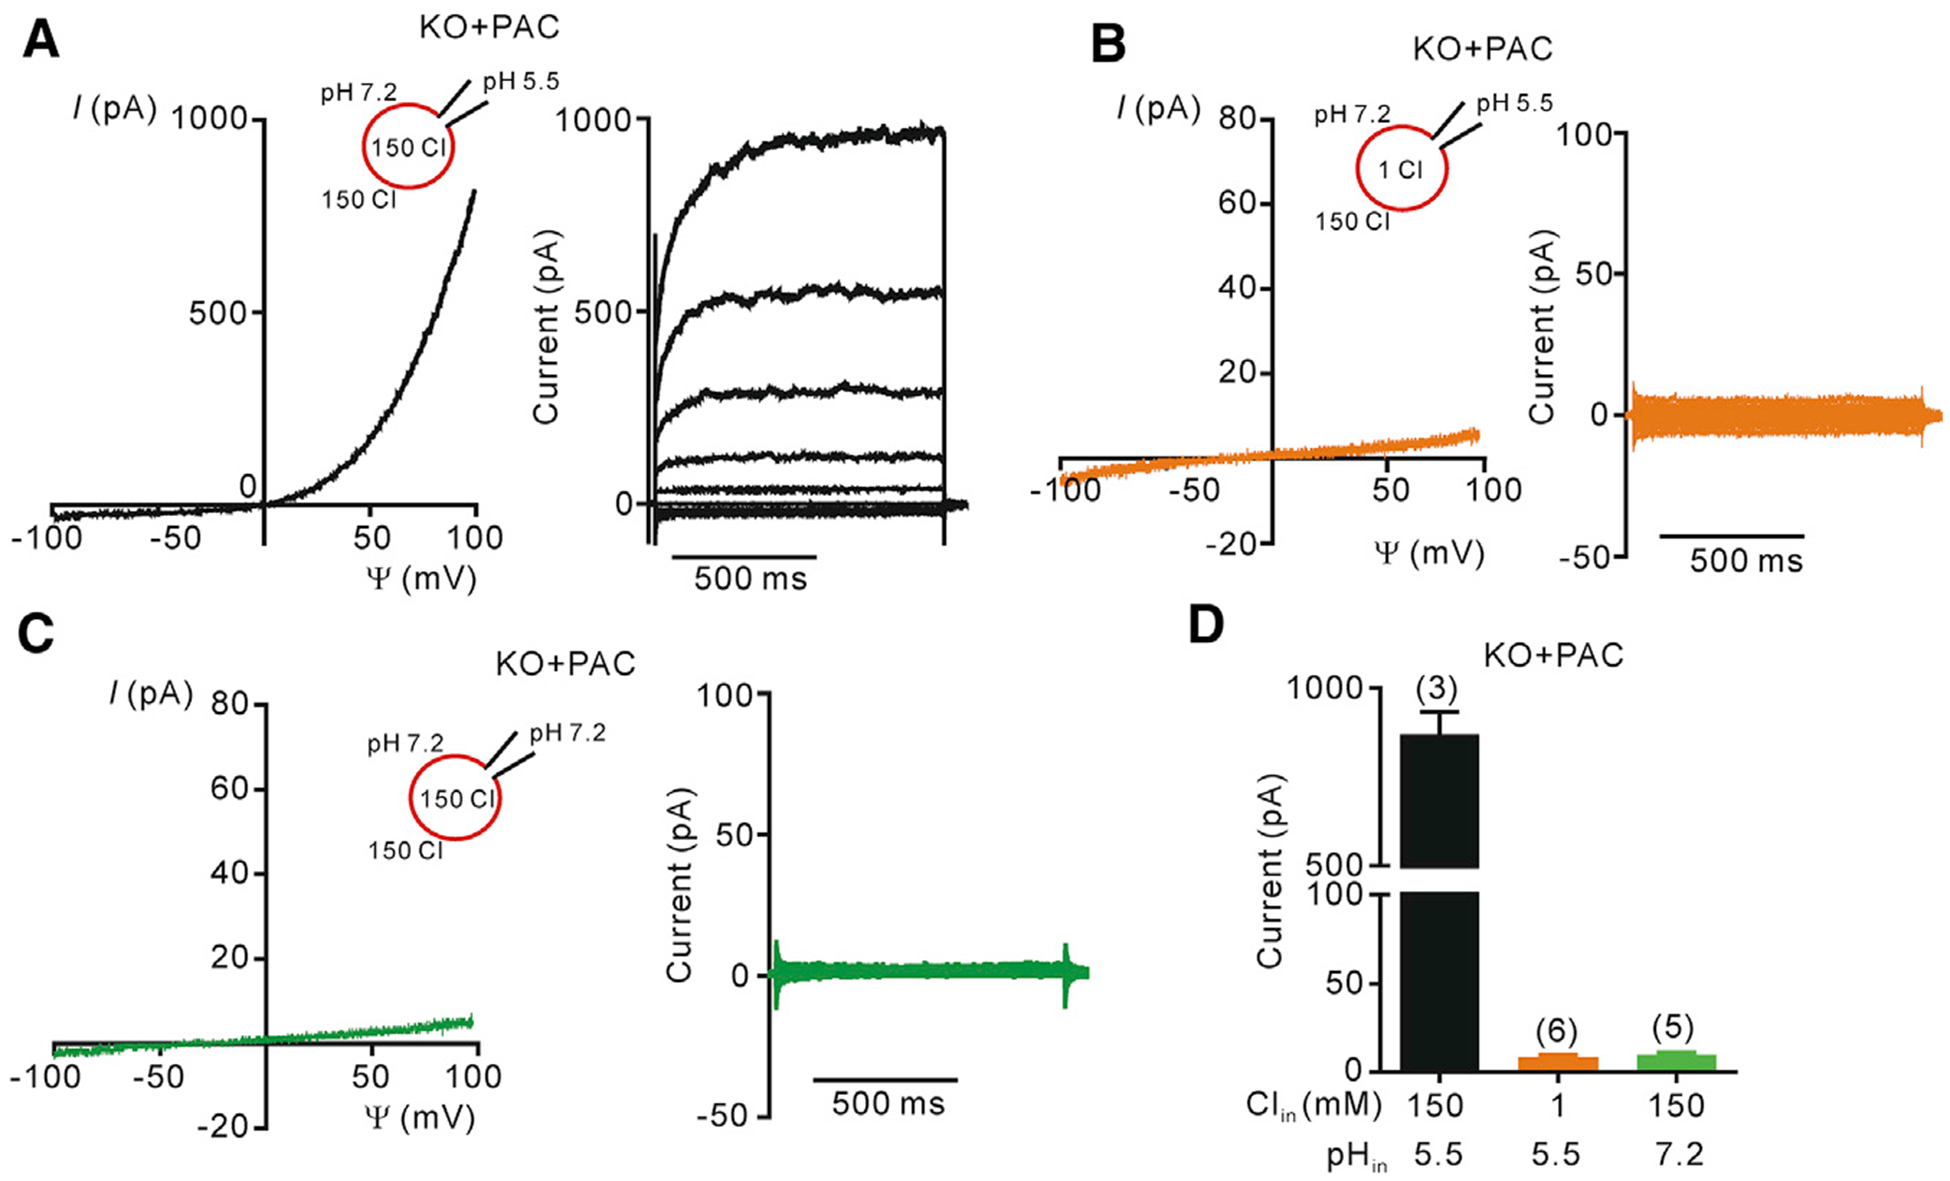
(A–C) PAC-mediated acid-sensitive currents monitored by voltage-ramp (left) and voltage-step (right) protocols in PAC KO endosomes: (A) (pH 5.5) 150 mM luminal and cytosolic Cl−; (B) (pH 5.5) 1 mM luminal and 150 mM cytosolic Cl−; and (C) (pH 7.2) 150 mM luminal and cytosolic Cl−. (D) Current amplitudes of (A)–(C) at +100 mV. Error bars represent mean ± SEM.
The PAC channel regulates endosomal pH and Cl− level
Cl− is known to neutralize the positive charge buildup from protons pumped by the V-ATPase and serves as an electrical shunt to facilitate endosomal acidification (Mindell, 2012; Stauber and Jentsch, 2013). We hypothesize that when the endosomal pH becomes too acidic, the PAC channel is activated, which mediates the Cl− efflux from the lumen to the cytosol, thus limiting further acidification (Figure 4A). To test this hypothesis, we quantified endosomal pH by a ratiometric method measuring the pH-sensitive fluorescence of fluorescein isothiocyanate (FITC)-tagged transferrin with flow cytometry, normalized for differences in endosomal uptake with pH-insensitive fluorescence of Alexa Fluor 633-tagged transferrin and calibrated with standard pH buffers (Kondapalli et al., 2015). Endosomal pH in PAC KO HEK293T cells was significantly reduced by ~0.34 pH units, compared to that in WT cells (Figure 4B). A similar degree of hyper-acidification was also observed in the endosomes of PAC KO HeLa cells (Figure S2A). In contrast, a low-tetracycline (5–10 ng/mL)-induced PAC overexpression resulted in a hypo-acidified endosomal pH, by ~0.4 pH units, compared with that of the parental HEK293 stable cells (Figure 4C). This effect was dependent on the endosomal localization of PAC, as cells expressing the trafficking mutants (Y10A and L13A) did not exhibit any endosomal hypo-acidification (Figure 4C). Consistent with the localization data (Figure 1F), unlike WT PAC, Y10A and L13A mutants did not increase the size of endosomal Cl− currents above the endogenous level in the parental cells (Figure 4D). Therefore, both the loss-of-function and gain-of-function experiments demonstrate that the PAC channel plays an important role in endosomal acidification.
Figure 4. PAC regulates endosomal pH, Cl− concentration, and transferrin-receptor-mediated endocytosis.
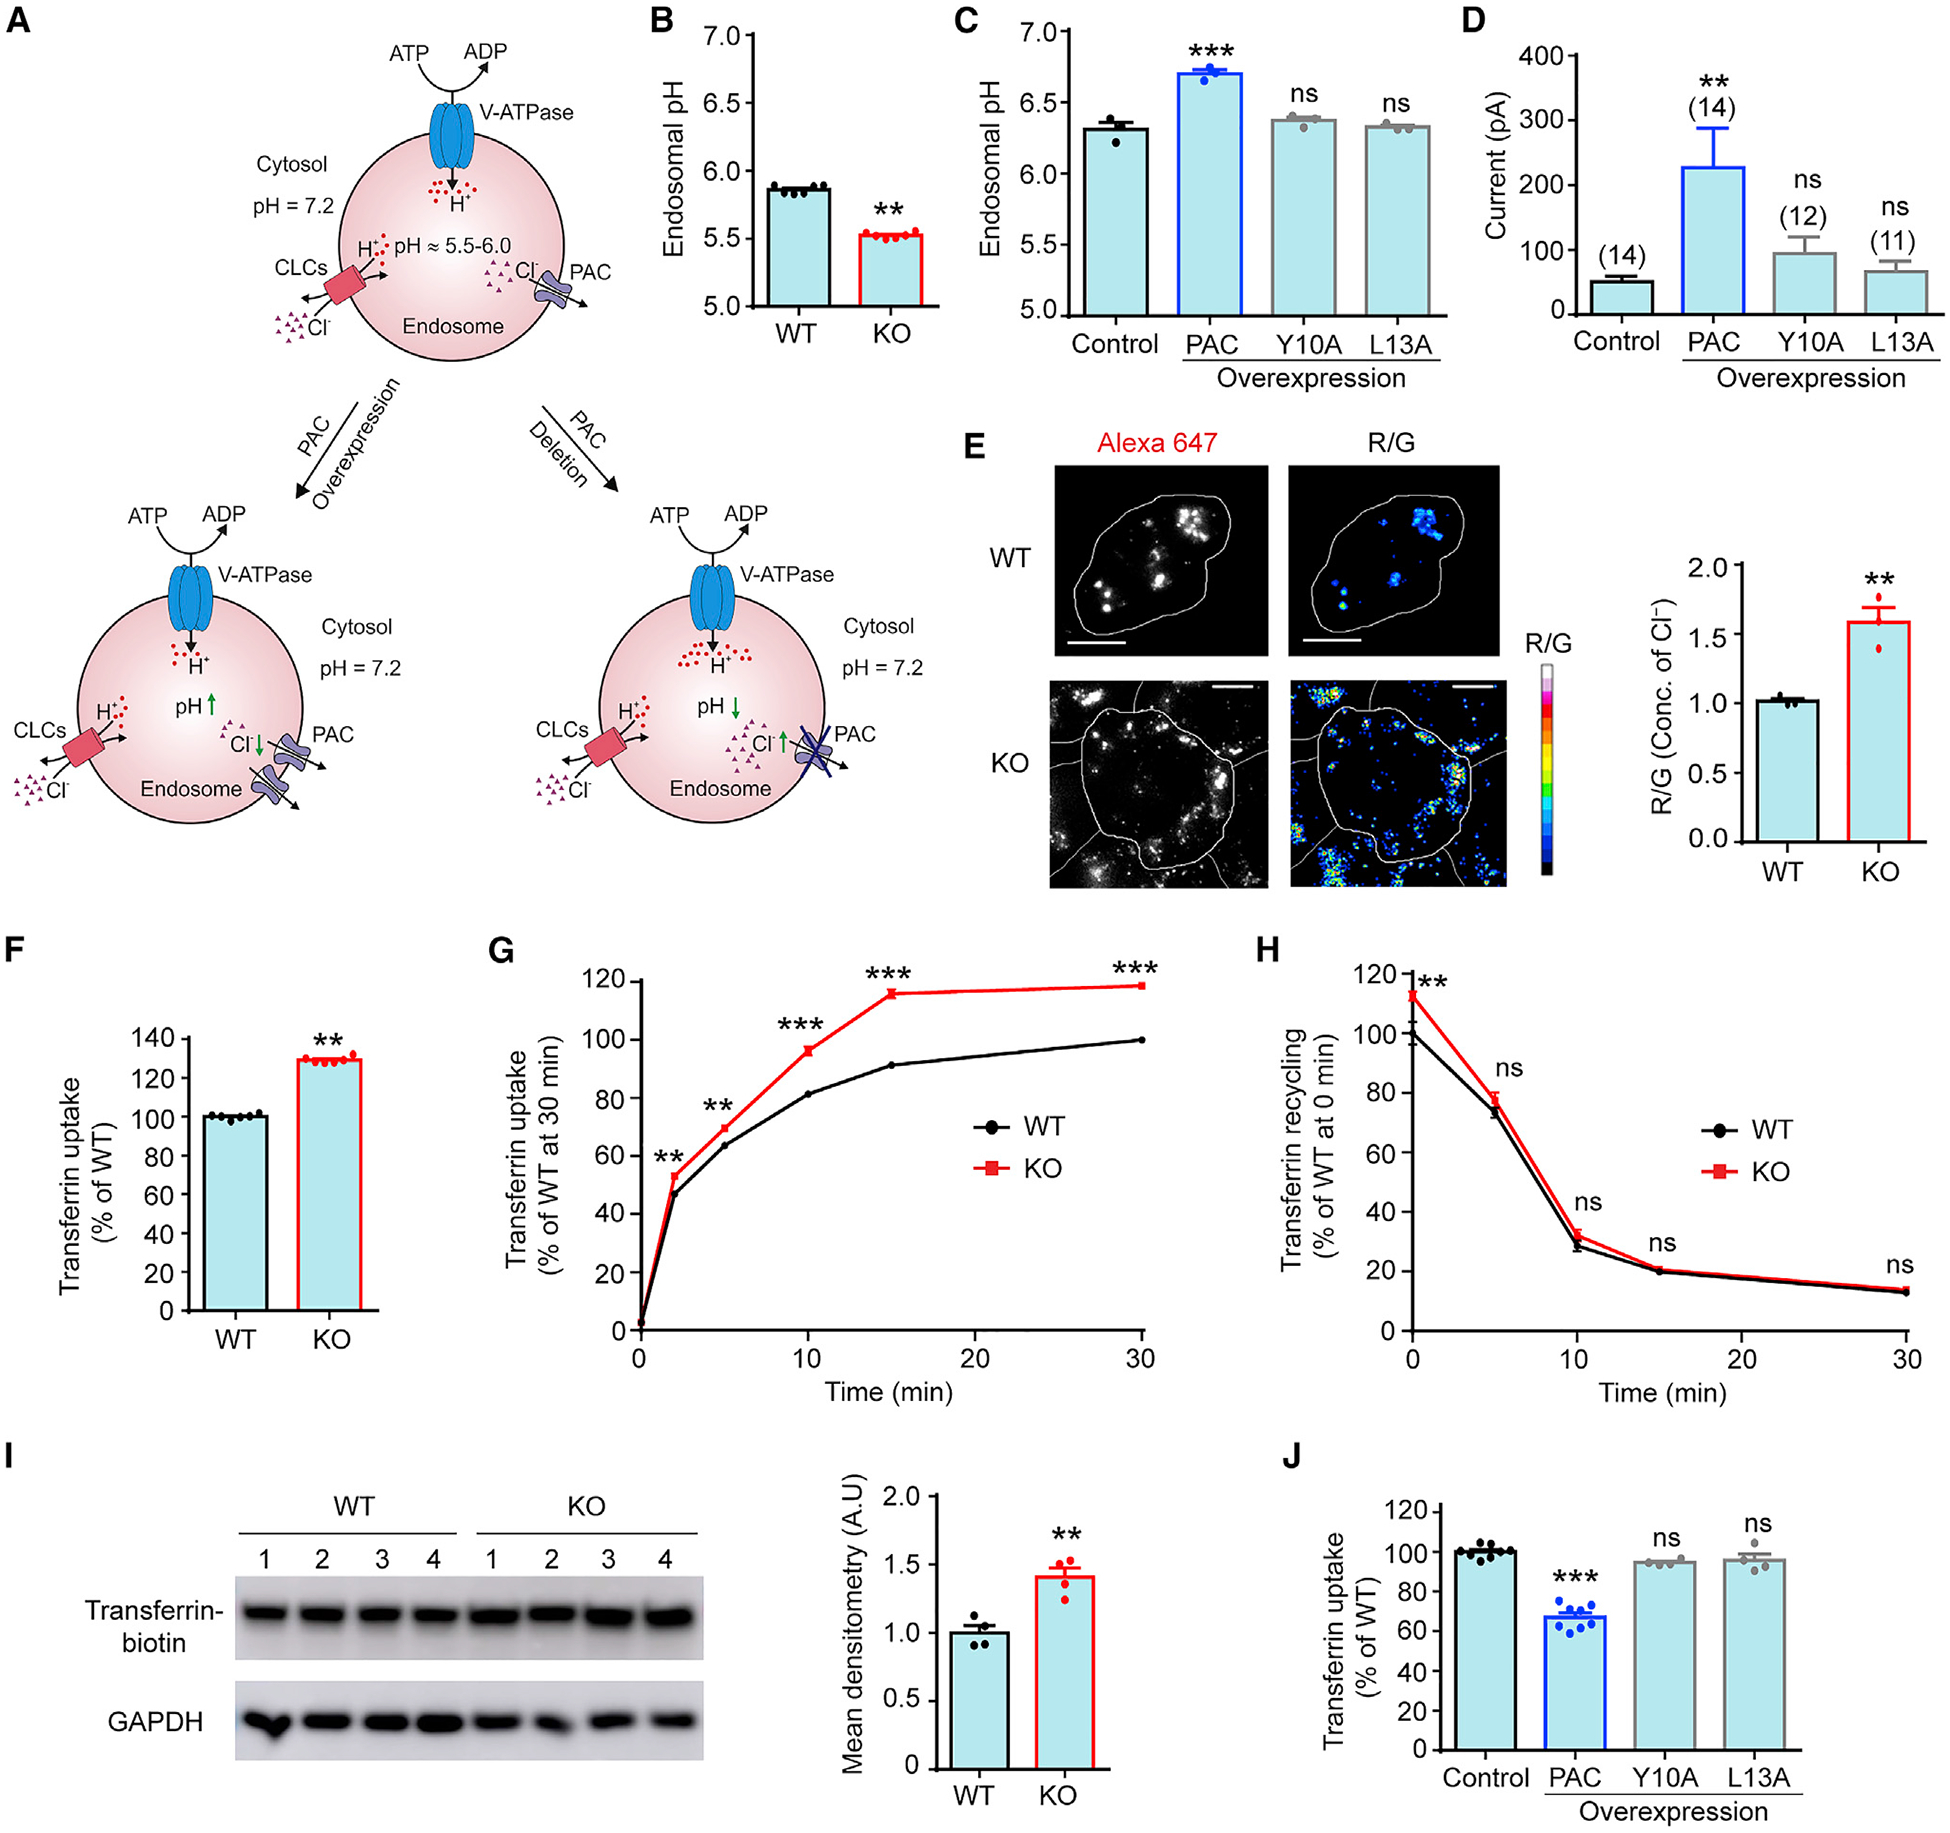
(A) A simple model focusing on Cl− in endosomal pH regulation: PAC functions as a pH sensor in endosomes and prevents hyper-acidification by releasing Cl− from the lumen. Loss and gain of PAC function result in high and low Cl−, hyper- and hypo-acidification, respectively.
(B) Ratiometric measurement of endosomal pH in WT and PAC KO HEK293T cells. Flow cytometry analysis of ~10,000 cells for each biological replicate n (mean ± SEM; n = 6). **p < 0.01, two-tailed Student’s t test.
(C) Ratiometric measurement of endosomal pH in low-tetracycline-induced PAC WT-, Y10A-, and L13A-overexpressing stable cells. The parental T-REx HEK293 cell line was used as control. Flow cytometry analysis of ~10,000 cells for each biological replicate n (mean ± SEM; n = 3). ***p < 0.0001, one-way analysis of variance (ANOVA) with Bonferroni post hoc test. ns, not significant.
(D) Current amplitudes of PAC-mediated endosomal Cl− currents at +100 mV for stable cells in (C). Luminal pH 5.5, 150 mM luminal and cytosolic Cl−. Error bars represent mean ± SEM. **p < 0.01, one-way ANOVA with Bonferroni post hoc test. ns, not significant.
(E) Representative Cl− maps and relative Cl− concentration of recycling endosomes in the transferrin pathway labeled with ClensorTf in WT and KO HEK293T cells. Pseudocolored R/G images represent the intensity of the reference dye Alexa Fluor 647 (R) divided by the intensity of the Cl−-sensitive dye BAC (G). Scale bars, 10 μm. Analysis of ~150 endosomes from 15 cells for each biological replicate n. Error bars represent mean ± SEM; n = 3. **p < 0.01, two-tailed Student’s t test.
(F) Normalized transferrin uptake at 30 min in WT (as 100%) and PAC KO HEK293T cells. Flow cytometry analysis of ~10,000 cells for each biological replicate n (mean ± SEM; n = 6). **p < 0.01, two-tailed Student’s t test.
(G) Normalized transferrin uptake kinetics of WT and KO HEK293T cells. Flow cytometry analysis of ~10,000 cells for each biological replicate n (mean ± SEM; n/time point = 3). **p < 0.01; ***p < 0.0001, two-way ANOVA with Bonferroni post hoc test. ns, not significant. Unapparent error bars are smaller than symbols in (G) and (H).
(H) Normalized transferrin recycling kinetics of WT and KO HEK293T cells. Flow cytometry analysis of ~10,000 cells for each biological replicate n (mean ± SEM; n/time point = 3). **p < 0.01, two-way ANOVA with Bonferroni post hoc test. ns, not significant.
(I) Cell-surface biotinylation (left) and densitometry analysis (right) of total accessible transferrin receptor on the cell surface of WT and PAC KO HEK293T cells. GAPDH is the loading control. Error bars represent mean ± SEM; n = 4 cell lysates. **p < 0.01, two-tailed Student’s t test.
(J) Normalized transferrin uptake at 30 min in low-tetracycline-induced PAC WT-, Y10A-, and L13A-overexpressing stable cells. Control (as 100%) is the parental T-REx HEK293 cell line. Flow cytometry analysis of ~10,000 cells for each biological replicate n (mean ± SEM; n = 4–8) ***p < 0.0001, one-way ANOVA with Bonferroni post hoc test. ns, not significant.
See also Figure S2.
To test whether the PAC channel prevents hyper-acidification by modulating endosomal Cl− concentration, we used a recently developed ratiometric Cl− sensor called Clensor (Saha et al., 2015). Clensor is a peptide nucleic acid (PNA)-DNA hybrid nano-device, where the PNA strand bears a Cl−-sensitive dye 10,10’-bis[3-carboxypropyl]-9,9’-biacridinium dinitrate (BAC) and the DNA strand bears a normalizing Alexa Fluor 647 label (Prakash et al., 2016). The ratio of the emission intensities (R/G) for Alexa Fluor 647 (red) and BAC (green) correlates linearly with physiological Cl− concentrations in a pH-independent manner. Clensor has been previously used to map lysosomal chloride in mammalian cells and in vivo in nematodes (Chakraborty et al., 2017). An RNA aptamer to human transferrin receptor was displayed on Clensor, to give ClensorTf, which is expected to label recycling endosomes exclusively (Wilner et al., 2012). We found that ClensorTf indeed showed ~80% colocalization in recycling endosomes in both HEK293T cells and PAC KO cells (Figures S2C and S2D). We observed that the normalized R/G ratios were ~50% higher in PAC KO cells compared to those in WT cells (Figure 4E). This indicates that loss of PAC significantly increases luminal Cl− concentration in recycling endosomes. Together with electrophysiology, these results suggest that the PAC channel releases Cl− from endosomes, thereby reducing luminal Cl− level and restricts potential hyper-acidification.
The PAC channel regulates receptor-mediated transferrin uptake
Endosomal pH is a critical regulator of receptor-mediated endocytosis, such as the classical transferrin receptor trafficking (Maxfield and McGraw, 2004). Based on the role of PAC in limiting endosomal acidification, we sought to test whether PAC could also regulate transferrin endocytosis. Therefore, we treated HEK293T cells with Alexa Fluor 488-conjugated transferrin for 30 min and measured transferrin accumulation by flow cytome try. We observed a significant increase (~30%) in transferrin uptake in PAC KO cells compared to that in WT cells (Figure 4F). A similar increase was also observed in HeLa PAC KO cells (Figure S2B). These data indicate that, consistent with the phenotype of endosomal hyper-acidification, the loss of PAC increases intracellular transferrin accumulation. Next, we examined the kinetics of transferrin uptake and recycling. Deletion of PAC increased the rate and steady-state levels of transferrin uptake, whereas it had no effect on the rate of recycling (Figures 4G and 4H). This indicates that more transferrin accumulation in PAC KO cells is due to an increase in transferrin uptake rather than a decrease in recycling back to the cell surface. The enhanced transferrin uptake in PAC KO cells could be due to the upregulation of transferrin receptor accessibility at the cell surface. To explore this possibility, we performed cell-surface biotinylation analysis and measured the total surface receptor accessible to transferrin binding. Indeed, we observed an increased surface accessibility of the transferrin receptor in PAC KO cells (Figure 4I), which may contribute to the increased transferrin uptake in the absence of PAC.
To test whether endosomal hypo-acidification in PAC-overex-pressing cells also leads to impaired transferrin endocytosis, we measured the transferrin uptake in low-tetracycline-induced PAC-overexpressing cells. We observed a significant decrease compared to that in the parental HEK293 stable cells (Figure 4J). Furthermore, cells expressing the trafficking mutants (Y10A and L13A) exhibited normal transferrin accumulation (Figure 4J). This suggests that it is the endosomal PAC channel, but not the plasma membrane PAC, that regulates endosomal acidification and receptor-mediated transferrin endocytosis.
DISCUSSION
We have uncovered a mechanism of endosomal Cl− permeability. It is well established that the CLC 2Cl−/H+ exchangers raise endosomal Cl− concentration and provide the electric shunt for proton pumping by the V-ATPase, thus facilitating endosomal acidification (Mindell, 2012; Stauber and Jentsch, 2013). Unlike the intracellular CLCs, the PAC channel is activated by low pH and leaks Cl− from the lumen. Thus, it antagonizes the activity of CLCs and serves as a “brake” to prevent endosomes from becoming too acidic (Figure 4A). In addition to the known CLCs, cation channels (K+, Na+, and Ca2+), and H+ leak pathways (Ishida et al., 2013), our findings have introduced a Cl− channel in maintaining endosomal pH homeostasis and revealed a previously unappreciated complexity in endosomal biology.
Although PAC is strongly outwardly rectifying, the small inward current could contribute to Cl− loading into the lumen under the proper electrochemical gradient, thus facilitating acidification. However, this is not consistent with the phenotype we observed in PAC KO (hyper-acidification) and overexpressing (hypo-acidification) cells. Because we measured the steady-state endosomal pH, we cannot exclude the possibility that PAC may transiently mediate Cl− influx under certain special conditions and promote acidification.
With a more acidic pH (~4.5–5.0), lysosomes would provide a perfect environment for PAC activation. However, PAC does not appear to traffic further to lysosomes. The lack of PAC, a Cl−-leaking channel, may contribute to the higher luminal Cl− concentration and increased acidity in lysosomes compared to endosomes. It was also suggested that lysosomes may rely on the efflux of luminal cations as an electrical shunt to facilitate acidification (Steinberg et al., 2010). An unbiased proteomic analysis previously revealed that the abundance of cell-surface PAC (TMEM206) is reduced in retromer (VPS35)-depleted cells, presumably due to lysosomal mis-sorting and subsequent degradation (Steinberg et al., 2013). This suggests that endosomal PAC is actively retrieved and recycled to the plasma membrane as a cargo of VPS35 retromer complex. Future studies will determine the molecular machineries responsible for both the endocytosis and recycling of PAC back to the plasma membrane.
Research on endosomal CLC exchangers (CLC3–5) provides strong evidence that endosomal pH and potentially Cl− concentration itself are important in regulating receptor-mediated endocytosis. Loss of CLC5 function in humans and mice leads to impaired endosomal acidification and defects in megalin/cubilin receptor-mediated endocytosis in the renal proximal tubule (Christensen et al., 2003; Lloyd et al., 1996; Piwon et al., 2000). This causes low-molecular-weight proteinuria, a major symptom of Dent’s disease. CLC4 KO fibroblasts exhibit alkalized endosomal pH and reduced receptor-mediated uptake of transferrin (Mohammad-Panah et al., 2009). Iron-bound transferrin binds to cell-surface receptors, and the transferrin-receptor complex is endocytosed (Dautry-Varsat et al., 1983). The acidic pH of less than 6.0 in endosomes facilitates the release of iron from transferrin. Iron-free transferrin is then recycled back to the cell surface, where it rapidly dissociates from its receptor at neutral pH and becomes accessible for subsequent iron-bound transferrin binding and internalization (Dautry-Varsat et al., 1983). Luminal alkalization inhibits iron dissociation from transferrin in endosomes, causing iron-bound transferrin to be recycled back to the cell surface, where it stays tightly bound to its receptor (Yamashiro and Maxfield, 1987), thereby decreasing transferrin receptor accessibility for continued uptake. Consistently, we observed reduced transferrin uptake in PAC-overexpressing cells with impaired endosomal acidification. On the other hand, in the absence of PAC, we detected increased transferrin endocytosis, correlating with increased receptor accessibility for transferrin binding at the cell surface. This suggests that endosomal hyper-acidification in PAC KO cells enhances the efficiency of iron dissociation from transferrin, resulting in higher receptor accessibility at the cell surface and subsequently more transferrin uptake. However, we cannot exclude the possibility that endosomal Cl− concentration directly regulates transferrin-receptor-mediated endocytosis.
The physiological role of transferrin is to deliver iron to cells and tissues through receptor-mediated endocytosis. Iron plays an essential role in the production of hemoglobin, which carries oxygen in the red blood cells. Thus, transferrin-receptor-mediated endocytosis is important in erythropoiesis through its role in iron uptake (De Domenico et al., 2008). Interestingly, two genomics studies have suggested a conserved role of PAC in adaptation to hypoxia. Exome sequencing of Tibetan highlanders identified PACC1 (TMEM206) as one of the genomic regions with the highest frequency change compared with those of ethnic Han Chinese individuals (Yi et al., 2010). Increased natural selection of the PACC1 locus has also been observed in pigs adapted to high altitudes (Dong et al., 2014). Our finding on the importance of PAC in transferrin-receptor-mediated endocytosis provides a potential mechanistic basis for its involvement in high-altitude adaption. Further work will determine whether PAC plays a physiological role in iron uptake and hypoxia-induced erythropoiesis in vivo.
The acid-sensitive PAC channel has been recorded and characterized as a plasma membrane ion channel in the past 2 decades (Capurro et al., 2015). Our molecular identification of PAC led to the surprising finding that PAC is also a bona fide endosomal Cl− channel, which immediately suggests a housekeeping function for this channel. Indeed, PAC regulates endosomal acidification and transferrin-receptor-mediated endocytosis. Given its broad expression in diverse cells and tissues, PAC may also regulate the trafficking and recycling of other membrane receptors, thus participating in their respective physiological processes. Future studies will also investigate the potential role for PAC in other acidic intracellular organelles in the secretory and endocytic pathways.
STAR★METHODS
RESOURCE AVAILABILITY
Lead contact
Further information and requests for resources and reagents should be directed to and will be fulfilled by the lead contact, Zhaozhu Qiu (zhaozhu@jhmi.edu).
Materials availability
All unique plasmids generated in this study are available from the lead contact upon request.
Data and code availability
No datasets/codes were generated in this study.
EXPERIMENTAL MODEL AND SUBJECT DETAILS
Cell culture and generation of stable cell lines
HEK293T cells and HeLa cells were maintained in Dulbecco’s modified Eagle’s medium (DMEM) supplemented with 10% fetal bovine serum (FBS) and 1% penicillin/streptomycin (P/S) at 37°C in humidified 95% CO2 incubator. Knockout cells were previously generated using CRISPR technology (Yang et al., 2019). Stable HEK293 cell lines expressing tetracycline-inducible FLAG-tagged PAC were generated using Flp-In T-REx system (Thermo Fisher Scientific) according to the manufacturer’s protocol. A single Flp recognition target (FRT) site was stably inserted into the HEK293 genome (Flp-In HEK293). The coding sequence of human PAC (NP_060722) was PCR-amplified from SC319176 (OriGene). The amplified product was subcloned into pcDNA5/FRT/TO plasmid using KpnI and EcoRV restriction sites. FLAG tag (DYKDDDDK), Y10A, and L13A mutagenesis were introduced into plasmids using QuikChange II XL site-directed mutagenesis kit (Agilent Technologies). The final construct was then co-transfected with a plasmid expressing the FLP recombinase (pOG44, Life technologies) into Flp-In HEK293 cells, followed by hygromycin (200 ug/ml) selection. Transfections were done using lipofectamine 2000 reagent (Invitrogen) according to the manufacturer’s protocol. Single cell colonies were picked and expanded in DMEM supplemented with 10% tetracycline-free Fetal Bovine Serum and 1% P/S. 5–10 ng/ml tetracycline were added to the stable cells for 24 h to induce low levels of PAC expression.
METHOD DETAILS
Immunostaining
Immunostaining was performed by first fixing cells with 4% paraformaldehyde (PFA) followed by washing with phosphate-buffered saline (PBS). Cells were then permeabilized and incubated with primary antibodies (mouse anti-PAC (1:50), mouse anti-FLAG (1:500; Sigma F1804), rabbit anti-EEA1 (1:200; Cell Signaling Technology (CST)), rabbit anti-LAMP1 (1:100; CST)) for 2 hours (h) at room temperature (RT) in PBS containing 1% BSA and 0.2% tween-20. This was followed with Alexa Fluor-conjugated secondary antibodies (1:1000; Thermo Fisher Scientific) incubation for 1 h at RT. Transferrin labeling was performed by incubating cells with Alexa Fluor 633-conjugated transferrin (200 μg/ml) at 37°C for 1 h, followed by PBS washing and fixing. For live cell labeling, cells were incubated with primary antibody (mouse anti-FLAG (1:200)) for 2 h at 4°C in PBS containing Ca2+ and Mg2+ prior to fixing with 4% PFA. Cells were washed and incubated with Alexa Fluor 488-conjugated secondary antibody (1:500) for 1 h at RT. Coverslips were then mounted on microscope slides with prolong gold antifade reagent (Invitrogen) and images were taken using Zeiss LSM700 confocal microscope. Colocalization quantification was determined from the Pearson’s correlation coefficient using the JACoP ImageJ plugin. Live cells for flow cytometry analysis were not PFA fixed after primary antibody incubation. Cells were washed and incubated with Alexa Fluor 488-conjugated secondary antibody (1:500) for 1 h at 4°C. Cells were then washed, dissociated non-enzymatically by gentle scraping and subjected to flow cytometry analysis. Fluorescence intensity was determined by analyzing ~10,000 cells for each biological replicate using FACSCalibur instrument (BD Biosciences).
Western blot
Cells were lysed with RIPA buffer (Sigma) and centrifuged at 13000 rpm for 15 min in 4°C. Proteins were resolved on SDS/PAGE and transferred onto a nitrocellulose membrane. The membrane was then blocked with 3% bovine serum albumin (BSA) in tris-buffered saline, with tween-20 (TBST) for 30 min at RT, followed by primary antibody incubation with mouse anti-PAC (1:200), mouse anti-FLAG (1:1000) or rabbit anti-GAPDH (1:1000; CST) at 4°C for overnight. After wash, the membranes were incubated with horseradish peroxidase (HRP)-conjugated secondary antibody for 1 h at RT. Immunoblot samples from cell-surface biotinylation were blocked in 5% BSA and then incubated with streptavidin HRP-conjugate (1:5000, Thermo Scientific) for 1 h. Proteins were then detected using Pierce ECL Plus Western Blotting Substrate (Thermo Scientific) and quantified using ImageJ.
Electrophysiology
Whole-cell patch clamp recordings were performed as previously described (Yang et al., 2019). Stable cells were plated on poly-D-lysine-coated coverslips and induced with tetracycline for 24 h before recording. Cells were recorded in an extracellular solution (ECS) containing (in mM): 145 NaCl, 1.5 CaCl2, 2 MgCl2, 2 KCl, 10 HEPES, and 10 glucose (pH adjusted to pH 7.3 with NaOH and osmolality was 300–310 mOsm/kg). Acidic ECS with pH 5.0 was made with the same ionic composition without HEPES but with 5 mM Na3-citrate as buffer and the pH was adjusted using citric acid. The acidic solution was perfused using a gravity perfusion system. Recording pipettes (2–4 MΩ) were filled with internal solution containing (in mM): 135 CsCl, 2 CaCl2, 1 MgCl2, 4 MgATP, 0.5 Na3 -GTP, and 5 EGTA (pH adjusted to 7.2 with CsOH and osmolality was 280–290 mOsm/kg).
Whole-endosome patch clamp recordings were performed as previously described (Chen et al., 2017). Endosomes were enlarged by transiently transfecting HEK293T cells and tetracycline-inducible HEK293 stable cells with mCherry-tagged Rab5-Q79L (a kind gift from Dr. Dejian Ren, University of Pennsylvania). For PAC overexpression, KO cells were co-transfected with human PAC cDNA and Rab5-Q79L. 1 day after transfection, cells with enlarged endosomes were raptured with a pipette to gently release the endosomes into the bath for patch clamping. Similar sized enlarged endosomes were picked for recording across different groups of cells. The bath solution contained (in mM): 150 NMDG-Cl and 10 HEPES (pH adjusted to pH 7.2 with NMDG and osmolality was 300–310 mOsm/kg). The pipette solution was also NMDG-based but with different pH and Cl− concentration. For pH 5.5, HEPES was replaced with MES buffer (10 mM) and pH was adjusted using methanesulfonic acid. For low Cl−, 1 mM HCl was used. Endosomal recording pipettes had a resistance of 5–8 MΩwhen filled with the internal solution.
All recordings were done at room temperature with MultiClamp 700B amplifier and 1550B digitizer (Molecular Devices). Data acquisition were performed with pClamp 10.7 software (Molecular Device), filtered at 2 kHz and digitized at 10 kHz. Voltage ramp pulses were applied every 5 s from −100 to +100 mV at a holding potential of 0 mV. Voltage step pulses were applied every 3 s for a duration of 1 s, from −100 to +100 mV at a holding potential of 0 mV in a 20-mV increment. All data were analyzed using Clampfit 10.7 and GraphPad Prism 6 software was used for all statistical analyses.
Endosomal pH measurement
Endosomal pH was measured by a ratiometric method as described previously (Kondapalli et al., 2015). Cells were starved in serum-free media for 30 min to remove residual transferrin, and incubated with pH-sensitive FITC-transferrin (Thermo Fisher Scientific) (75 μg/mL) and pH insensitive Alexa Fluor 633-transferrin (Thermo Fisher Scientific) (25 μg/mL) at 37°C for 1 h. Transferrin uptake was stopped by placing cells on ice. Cells were then washed twice with ice-cold PBS pH 7.4 to remove excess transferrin, followed by ice-cold PBS pH 5.0 and pH 7.4 to remove surface bound transferrin. Cells were trypsinized and analyzed by flow cytometry. Cells with both FITC-transferrin and Alexa Fluor 633-transferrin were gated and a ratiometric analysis of ~10,000 cells for each biological replicate was used to determine the endosomal pH. A standard curve with different pH values 4.5, 5.5, 6.5, and 7.5 was constructed using the Intracellular pH Calibration Buffer kit (Thermo Fisher Scientific) in the presence of 10 μM K+/H+ ionophore nigericin and 10 μM K+ ionophore valinomycin to equilibrium the endosomal pH with the calibration buffers.
Transferrin uptake and recycling
Transferrin uptake was measured by using pH-insensitive Alexa Fluor 488-transferrin as described previously (Kondapalli et al., 2015). Cells were starved in serum-free media for 30 min, followed by incubation with Alexa Fluor 488-transferrin (Thermo Fisher Scientific) (100 μg/mL) for 30 min at 37°C. For uptake kinetics, cells were incubated with Alexa Fluor 488-transferrin for 2, 5, 10, 15, and 30 min. For transferrin recycling kinetics, cells were incubated with Alexa Fluor 488-transferrin for 30 min, washed twice with ice-cold PBS pH 7.4 and incubated in normal media for 0, 5, 10, 15, and 30 min. Cells were then washed with ice-cold PBS pH 7.4 to remove excess transferrin, followed by ice-cold PBS pH 5.0 and pH 7.4 to remove surface bound transferrin. Transferrin uptake or recycling were quantified by analyzing ~10,000 cells using flow cytometry. Surface accessible transferrin receptors was determined by cell surface biotinylation. Starved cells were incubated with biotin conjugated transferrin (50 μg/mL, Thermo Fisher Scientific) for 30 min at 4°C and washed twice with ice-cold PBS pH 7.4 to remove excess transferrin. Cells were then lysed for western blot.
Endosomal chloride measurement
All fluorescently labeled DNA strands were HPLC-purified and obtained from IDT and IBA Lifesciences (Germany). The 12-mer peptide nucleic acid (PNA) strand was conjugated with the pH-independent Cl− sensitive dye, BAC. BAC was prepared according to a reported method (Prakash et al., 2016). To prepare ClensorTf and Clensor-Alexa Fluor 647, all oligonucleotides were purified by ethanol precipitation and quantified by their UV absorbance (260 nm). For ClensorTf, 20 μM of D1Tfapt, D2 and P were mixed in 1:1:1 ratio in 10 mM sodium phosphate buffer, pH 7.2. For Clensor-Alexa Fluor 647, 20 μM of D2 and D3 were mixed in 1:1 ratio in 10 mM sodium phosphate buffer, pH 7.2. The mixture was heated to 95°C for 10 min, cooled to RT at 5°C per 15 min and stored at 4°C overnight (Chakraborty et al., 2017; Saha et al., 2015). See Table S1 for detail sequence information.
For Colocalization experiments, cells were washed with PBS three times and pulsed with 50 μg/mL transferrin-Alexa Fluor 546 and 2 μM ClensorTf for 30 min. Cells were then washed with PBS three times and chased for 30 min before imaging in Hank’s Buffered Salt Solution (HBSS). Cross talk and bleed-through were measured and found to be negligible between the TMR channel and Alexa Fluor 647 channel (Modi et al., 2009, 2013). Pearson’s correlation coefficient (PCC) measures the pixel-by-pixel covariance in the signal levels of two images. Tools for quantifying PCC are provided in ImageJ software. PCC values range from 0–1 with 1 being complete colocalization. To ensure that the colocalization observed is not random, we perform a pixel-shifted PCC as well. Upon pixel shift, PCC values decrease significantly suggesting non-random colocalization.
For recycling endosomes labeling validation, cells were transfected with human macrophage scavenger receptors according to a reported protocol (Saminathan et al., 2021). The transfected cells were washed with PBS three times and pulsed with 50 μg/mL Transferrin-Alexa Fluor 546 and 2 μM dsDNA for 30 min. Cells were washed with PBS three times and chased with 2 μM dsDNA for 30 min before imaging in HBSS.
Sequence alignment
PAC N-terminal sequence alignment was created using Clustal Omega (CLUSTAL O (1.2.4) multiple sequence alignment). Protein sequences from different vertebrate species were obtained from UniProt: human (PACC1_HUMAN), rat (PACC1_RAT), mouse (PACC1_MOUSE), frog (PACC1_XENTR), dog (E2RTL9_CANLF), chicken (E1C5B3_CHICK), zebrafish (X1WG42_DANRE).
QUANTIFICATION AND STATISTICAL ANALYSIS
Data and statistical analyses were performed using Clampfit 10.7, ImageJ, GraphPad Prism 6, and Excel. Statistical analysis between two groups were performed using two-tailed Student’s t test, unless reported otherwise. Multiple group comparisons were performed using one-way analysis of variance (ANOVA) with Bonferroni post hoc test. Non-significant ‘ns’ p values were not reported. All numeric data are shown as mean ± SEM and numbers per group are represented in bars or legends of each panel. The significance level was set at p < 0.05.
Supplementary Material
KEY RESOURCES TABLE
| REAGENT or RESOURCE | SOURCE | IDENTIFIER |
|---|---|---|
| Antibodies | ||
| Mouse anti-PAC | This paper | N/A |
| Mouse anti-FLAG | Sigma-Aldrich | Cat#F1804; RRID: AB_262044 |
| Rabbit anti-EEA1 | Cell Signaling Technology | Cat#3288; RRID: AB_2096811 |
| Rabbit anti-LAMP1 | Cell Signaling Technology | Cat#9091: RRID: AB_2687579 |
| Rabbit anti-GAPDH | Cell Signaling Technology | Cat#2118; RRID: AB_561053 |
| Alexa Fluor 546 Goat anti-mouse | Thermo Fisher Scientific | Cat# A11018; RRID: AB_1944229 |
| Alexa Fluor 488 Goat anti-mouse | Thermo Fisher Scientific | Cat# A11017; RRID: AB_2107298 |
| Chemicals, peptides, and recombinant proteins | ||
| Transferrin from human serum, biotin-xx | Thermo Fisher Scientific | Cat#T23363 |
| Transferrin from human serum, Alexa Fluor 633 conjugate | Thermo Fisher Scientific | Cat#T23362 |
| Transferrin from human serum, Alexa Fluor 488 conjugate | Thermo Fisher Scientific | Cat#T13342 |
| Transferrin from human serum, fluorescein conjugate | Thermo Fisher Scientific | Cat#T2871 |
| RIPA buffer | Sigma | Cat#R0278 |
| Clensor | Saha et al., 2015 | N/A |
| Intracellular pH Calibration Buffer Kit | Life Technologies | Cat#1787810 |
| Experimental models: cell lines | ||
| Human: Human embryonic kidney (HEK293T) cells | ATCC | Cat#CRL-3216 |
| Human: Flip-In T-REx 293 cells | Thermo Fisher Scientific | Cat#R78007 |
| Human: HeLa cells | ATCC | Cat#CCL-2 |
| Oligonucleotides | ||
| See Table S1 for list of oligonucleotides | This paper | N/A |
| Recombinant DNA | ||
| pcDNA5/FRT/TO PAC-FLAGC | This paper | N/A |
| pcDNA5/FRT/TO PAC-FLAG277 | This paper | N/A |
| pmCherry-Cl Rab5-Q79L | Dr. Dejian Ren | N/A |
| Software and algorithms | ||
| GraphPad Prism | GraphPad Software | https://www.graphpad.com/; RRID:SCR_002798 |
| pCLAMP 10.7 | Molecular Devices | http://www.moleculardevices.com/products/software/pclamp.html; RRID:SCR_011323 |
| Clampfit 10.7 | Molecular Devices | N/A |
| Zen 2.3 | ZEISS | http://www.zeiss.com/microscopy/en_us/products/microscope-software/zen.html#introduction; RRID:SCR_013672 |
| CorelDraw11 | Corel Corporation | https://www.coreldraw.com/en/; RRID: SCR_014235 |
| ImageJ | NIH | https://imagej.nih.gov/ij/ |
Highlights.
PAC traffics from the plasma membrane to the early and recycling endosomes
PAC mediates an acid-sensitive Cl− current in endosomes
PAC regulates endosomal pH and Cl− level
PAC regulates receptor-mediated transferrin endocytosis
ACKNOWLEDGMENTS
We thank Dr. Dejian Ren (University of Pennsylvania) for kindly providing the Rab5-Q79L construct and advice on whole-endosome recording; Drs. Rajini Rao and Hari Prasad (Johns Hopkins University) for helpful discussion; and Dr. Dan Cawley (Oregon Health & Science University) for raising PAC monoclonal antibody. J. O.-O. is supported by an American Heart Association (AHA) predoctoral fellowship (grant 18PRE34060025). J.Y. is supported by an AHA and American Brain Foundation postdoctoral fellowship (grant 20POST35200185). K.L. is supported by the Orphan Disease Center at the University of Pennsylvania (grant MDBR-19-123-NPC-6-34637). Z.R. is supported by an AHA postdoctoral fellowship (grant 20POST35120556). W.L. is supported by the National Institutes of Health (NIH) (grant R01NS112363). Y.K. is supported by the NIH (grants R01NS112139-01A1 and R21NS114428). Z.Q. is supported by a McKnight Scholar award, a Klingenstein-Simon Scholar award, a Sloan Research Fellowship in Neuroscience, and the NIH (grants R35GM124824 and R01NS118014).
Footnotes
SUPPLEMENTAL INFORMATION
Supplemental Information can be found online at https://doi.org/10.1016/j.celrep.2020.108683.
DECLARATION OF INTERESTS
The authors declare no competing interests.
REFERENCES
- Bertl A, Blumwald E, Coronado R, Eisenberg R, Findlay G, Gradmann D, Hille B, Köhler K, Kolb HA, MacRobbie E, et al. (1992). Electrical measurements on endomembranes. Science 258, 873–874. [DOI] [PubMed] [Google Scholar]
- Cang C, Bekele B, and Ren D (2014). The voltage-gated sodium channel TPC1 confers endolysosomal excitability. Nat. Chem. Biol 10, 463–469. [DOI] [PubMed] [Google Scholar]
- Cang C, Aranda K, Seo YJ, Gasnier B, and Ren D (2015). TMEM175 Is an Organelle K(+) Channel Regulating Lysosomal Function. Cell 162, 1101–1112. [DOI] [PubMed] [Google Scholar]
- Capurro V, Gianotti A, Caci E, Ravazzolo R, Galietta LJ, and Zegarra-Moran O (2015). Functional analysis of acid-activated Cl− channels: properties and mechanisms of regulation. Biochim. Biophys. Acta 1848 (1 Pt A), 105–114. [DOI] [PubMed] [Google Scholar]
- Chakraborty K, Leung K, and Krishnan Y (2017). High lumenal chloride in the lysosome is critical for lysosome function. eLife 6, e28862. [DOI] [PMC free article] [PubMed] [Google Scholar]
- Chen CC, Cang C, Fenske S, Butz E, Chao YK, Biel M, Ren D, Wahl-Schott C, and Grimm C (2017). Patch-clamp technique to characterize ion channels in enlarged individual endolysosomes. Nat. Protoc 12, 1639–1658. [DOI] [PubMed] [Google Scholar]
- Christensen EI, Devuyst O, Dom G, Nielsen R, Van der Smissen P, Verroust P, Leruth M, Guggino WB, and Courtoy PJ (2003). Loss of chloride channel ClC-5 impairs endocytosis by defective trafficking of megalin and cubilin in kidney proximal tubules. Proc. Natl. Acad. Sci. USA 100, 8472–8477. [DOI] [PMC free article] [PubMed] [Google Scholar]
- Dautry-Varsat A, Ciechanover A, and Lodish HF (1983). pH and the recycling of transferrin during receptor-mediated endocytosis. Proc. Natl. Acad. Sci. USA 80, 2258–2262. [DOI] [PMC free article] [PubMed] [Google Scholar]
- De Domenico I, McVey Ward D, and Kaplan J (2008). Regulation of iron acquisition and storage: consequences for iron-linked disorders. Nat. Rev. Mol. Cell Biol 9, 72–81. [DOI] [PubMed] [Google Scholar]
- Dong K, Yao N, Pu Y, He X, Zhao Q, Luan Y, Guan W, Rao S, and Ma Y (2014). Genomic scan reveals loci under altitude adaptation in Tibetan and Dahe pigs. PLoS ONE 9, e110520. [DOI] [PMC free article] [PubMed] [Google Scholar]
- Ishida Y, Nayak S, Mindell JA, and Grabe M (2013). A model of lysosomal pH regulation. J. Gen. Physiol 141, 705–720. [DOI] [PMC free article] [PubMed] [Google Scholar]
- Kondapalli KC, Llongueras JP, Capilla-González V, Prasad H, Hack A, Smith C, Guerrero-Cázares H, Quiñones-Hinojosa A, and Rao R (2015). A leak pathway for luminal protons in endosomes drives oncogenic signalling in glioblastoma. Nat. Commun 6, 6289. [DOI] [PMC free article] [PubMed] [Google Scholar]
- Lambert S, and Oberwinkler J (2005). Characterization of a proton-activated, outwardly rectifying anion channel. J. Physiol 567, 191–213. [DOI] [PMC free article] [PubMed] [Google Scholar]
- Lloyd SE, Pearce SH, Fisher SE, Steinmeyer K, Schwappach B, Scheinman SJ, Harding B, Bolino A, Devoto M, Goodyer P, et al. (1996). A common molecular basis for three inherited kidney stone diseases. Nature 379, 445–449. [DOI] [PubMed] [Google Scholar]
- Maxfield FR, and McGraw TE (2004). Endocytic recycling. Nat. Rev. Mol. Cell Biol 5, 121–132. [DOI] [PubMed] [Google Scholar]
- Mellman I, Fuchs R, and Helenius A (1986). Acidification of the endocytic and exocytic pathways. Annu. Rev. Biochem 55, 663–700. [DOI] [PubMed] [Google Scholar]
- Mindell JA (2012). Lysosomal acidification mechanisms. Annu. Rev. Physiol 74, 69–86. [DOI] [PubMed] [Google Scholar]
- Modi S, M G S, Goswami D, Gupta GD, Mayor S, and Krishnan Y (2009). A DNA nanomachine that maps spatial and temporal pH changes inside living cells. Nat. Nanotechnol 4, 325–330. [DOI] [PubMed] [Google Scholar]
- Modi S, Nizak C, Surana S, Halder S, and Krishnan Y (2013). Two DNA nanomachines map pH changes along intersecting endocytic pathways inside the same cell. Nat. Nanotechnol 8, 459–467. [DOI] [PubMed] [Google Scholar]
- Mohammad-Panah R, Wellhauser L, Steinberg BE, Wang Y, Huan LJ, Liu XD, and Bear CE (2009). An essential role for ClC-4 in transferrin receptor function revealed in studies of fibroblasts derived from Clcn4-null mice. J. Cell Sci 122, 1229–1237. [DOI] [PubMed] [Google Scholar]
- Osei-Owusu J, Yang J, Del Carmen Vitery M, Tian M, and Qiu Z (2020). PAC proton-activated chloride channel contributes to acid-induced cell death in primary rat cortical neurons. Channels (Austin) 14, 53–58. [DOI] [PMC free article] [PubMed] [Google Scholar]
- Piwon N, Günther W, Schwake M, Bösl MR, and Jentsch TJ (2000). ClC-5 Cl− -channel disruption impairs endocytosis in a mouse model for Dent’s disease. Nature 408, 369–373. [DOI] [PubMed] [Google Scholar]
- Prakash V, Saha S, Chakraborty K, and Krishnan Y (2016). Rational design of a quantitative, pH-insensitive, nucleic acid based fluorescent chloride reporter. Chem. Sci. (Camb.) 7, 1946–1953. [DOI] [PMC free article] [PubMed] [Google Scholar]
- Ruan Z, Osei-Owusu J, Du J, Qiu Z, and Lü W (2020). Structures and pH-sensing mechanism of the proton-activated chloride channel. Nature 588, 350–354. [DOI] [PMC free article] [PubMed] [Google Scholar]
- Saha S, Prakash V, Halder S, Chakraborty K, and Krishnan Y (2015). A pH-independent DNA nanodevice for quantifying chloride transport in organelles of living cells. Nat. Nanotechnol 10, 645–651. [DOI] [PubMed] [Google Scholar]
- Saminathan A, Devany J, Veetil AT, Suresh B, Pillai KS, Schwake M, and Krishnan Y (2021). A DNA-based voltmeter for organelles. Nat. Nanotechnol 16, 96–103. 10.1038/s41565-020-00784-1. [DOI] [PMC free article] [PubMed] [Google Scholar]
- Sato-Numata K, Numata T, Okada T, and Okada Y (2013). Acid-sensitive outwardly rectifying (ASOR) anion channels in human epithelial cells are highly sensitive to temperature and independent of ClC-3. Pflugers Arch 465, 1535–1543. [DOI] [PubMed] [Google Scholar]
- Stauber T, and Jentsch TJ (2013). Chloride in vesicular trafficking and function. Annu. Rev. Physiol 75, 453–477. [DOI] [PubMed] [Google Scholar]
- Steinberg BE, Huynh KK, Brodovitch A, Jabs S, Stauber T, Jentsch TJ, and Grinstein S (2010). A cation counterflux supports lysosomal acidification. J. Cell Biol 189, 1171–1186. [DOI] [PMC free article] [PubMed] [Google Scholar]
- Steinberg F, Gallon M, Winfield M, Thomas EC, Bell AJ, Heesom KJ, Tavaré JM, and Cullen PJ (2013). A global analysis of SNX27-retromer assembly and cargo specificity reveals a function in glucose and metal ion transport. Nat. Cell Biol 15, 461–471. [DOI] [PMC free article] [PubMed] [Google Scholar]
- Stenmark H, Parton RG, Steele-Mortimer O, Lütcke A, Gruenberg J, and Zerial M (1994). Inhibition of rab5 GTPase activity stimulates membrane fusion in endocytosis. EMBO J 13, 1287–1296. [DOI] [PMC free article] [PubMed] [Google Scholar]
- Traub LM, and Bonifacino JS (2013). Cargo recognition in clathrin-mediated endocytosis. Cold Spring Harb. Perspect. Biol 5, a016790. [DOI] [PMC free article] [PubMed] [Google Scholar]
- Ullrich F, Blin S, Lazarow K, Daubitz T, von Kries JP, and Jentsch TJ (2019). Identification of TMEM206 proteins as pore of PAORAC/ASOR acid-sensitive chloride channels. eLife 8, e49187. [DOI] [PMC free article] [PubMed] [Google Scholar]
- Wang HY, Shimizu T, Numata T, and Okada Y (2007). Role of acid-sensitive outwardly rectifying anion channels in acidosis-induced cell death in human epithelial cells. Pflugers Arch 454, 223–233. [DOI] [PubMed] [Google Scholar]
- Wilner SE, Wengerter B, Maier K, de Lourdes Borba Magalhães M, Del Amo DS, Pai S, Opazo F, Rizzoli SO, Yan A, and Levy M (2012). An RNA alternative to human transferrin: a new tool for targeting human cells. Mol. Ther. Nucleic Acids 1, e21. [DOI] [PMC free article] [PubMed] [Google Scholar]
- Yamashiro DJ, and Maxfield FR (1987). Kinetics of endosome acidification in mutant and wild-type Chinese hamster ovary cells. J. Cell Biol 105, 2713–2721. [DOI] [PMC free article] [PubMed] [Google Scholar]
- Yang J, Chen J, Del Carmen Vitery M, Osei-Owusu J, Chu J, Yu H, Sun S, and Qiu Z (2019). PAC, an evolutionarily conserved membrane protein, is a proton-activated chloride channel. Science 364, 395–399. [DOI] [PMC free article] [PubMed] [Google Scholar]
- Yi X, Liang Y, Huerta-Sanchez E, Jin X, Cuo ZX, Pool JE, Xu X, Jiang H, Vinckenbosch N, Korneliussen TS, et al. (2010). Sequencing of 50 human exomes reveals adaptation to high altitude. Science 329, 75–78. [DOI] [PMC free article] [PubMed] [Google Scholar]
Associated Data
This section collects any data citations, data availability statements, or supplementary materials included in this article.
Supplementary Materials
Data Availability Statement
No datasets/codes were generated in this study.