


Figure 4. PAC regulates endosomal pH, Cl− concentration, and transferrin-receptor-mediated endocytosis.
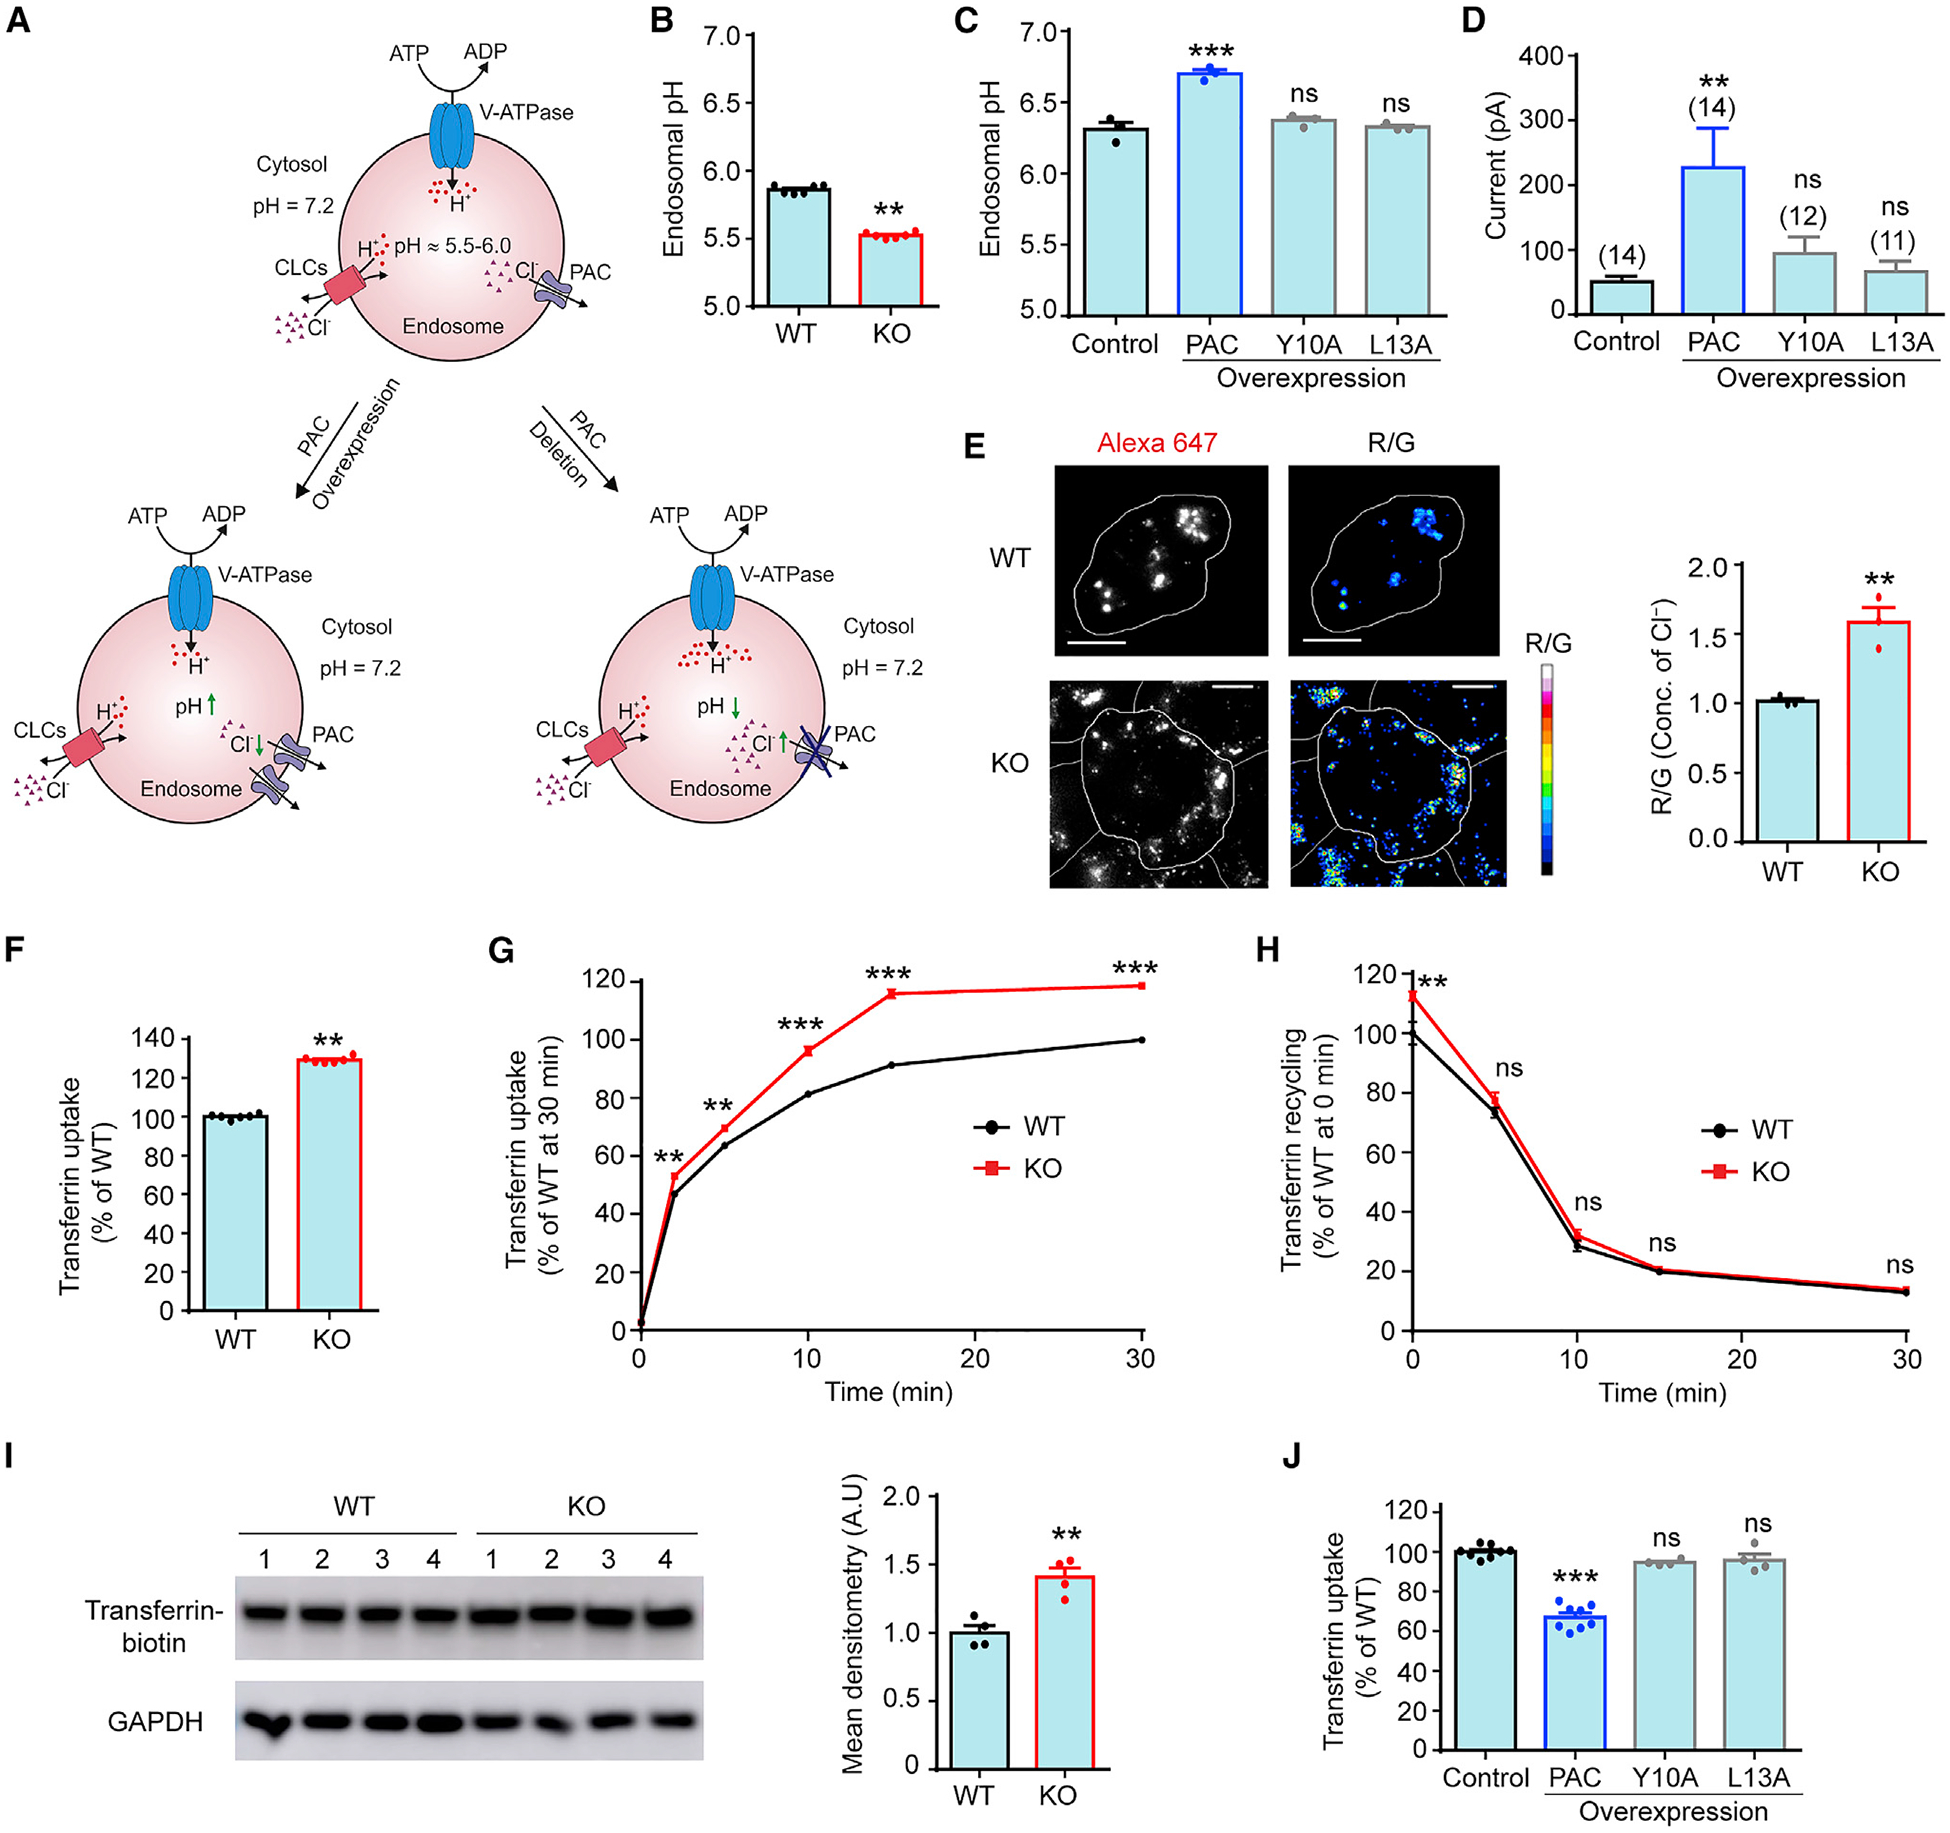
(A) A simple model focusing on Cl− in endosomal pH regulation: PAC functions as a pH sensor in endosomes and prevents hyper-acidification by releasing Cl− from the lumen. Loss and gain of PAC function result in high and low Cl−, hyper- and hypo-acidification, respectively.
(B) Ratiometric measurement of endosomal pH in WT and PAC KO HEK293T cells. Flow cytometry analysis of ~10,000 cells for each biological replicate n (mean ± SEM; n = 6). **p < 0.01, two-tailed Student’s t test.
(C) Ratiometric measurement of endosomal pH in low-tetracycline-induced PAC WT-, Y10A-, and L13A-overexpressing stable cells. The parental T-REx HEK293 cell line was used as control. Flow cytometry analysis of ~10,000 cells for each biological replicate n (mean ± SEM; n = 3). ***p < 0.0001, one-way analysis of variance (ANOVA) with Bonferroni post hoc test. ns, not significant.
(D) Current amplitudes of PAC-mediated endosomal Cl− currents at +100 mV for stable cells in (C). Luminal pH 5.5, 150 mM luminal and cytosolic Cl−. Error bars represent mean ± SEM. **p < 0.01, one-way ANOVA with Bonferroni post hoc test. ns, not significant.
(E) Representative Cl− maps and relative Cl− concentration of recycling endosomes in the transferrin pathway labeled with ClensorTf in WT and KO HEK293T cells. Pseudocolored R/G images represent the intensity of the reference dye Alexa Fluor 647 (R) divided by the intensity of the Cl−-sensitive dye BAC (G). Scale bars, 10 μm. Analysis of ~150 endosomes from 15 cells for each biological replicate n. Error bars represent mean ± SEM; n = 3. **p < 0.01, two-tailed Student’s t test.
(F) Normalized transferrin uptake at 30 min in WT (as 100%) and PAC KO HEK293T cells. Flow cytometry analysis of ~10,000 cells for each biological replicate n (mean ± SEM; n = 6). **p < 0.01, two-tailed Student’s t test.
(G) Normalized transferrin uptake kinetics of WT and KO HEK293T cells. Flow cytometry analysis of ~10,000 cells for each biological replicate n (mean ± SEM; n/time point = 3). **p < 0.01; ***p < 0.0001, two-way ANOVA with Bonferroni post hoc test. ns, not significant. Unapparent error bars are smaller than symbols in (G) and (H).
(H) Normalized transferrin recycling kinetics of WT and KO HEK293T cells. Flow cytometry analysis of ~10,000 cells for each biological replicate n (mean ± SEM; n/time point = 3). **p < 0.01, two-way ANOVA with Bonferroni post hoc test. ns, not significant.
(I) Cell-surface biotinylation (left) and densitometry analysis (right) of total accessible transferrin receptor on the cell surface of WT and PAC KO HEK293T cells. GAPDH is the loading control. Error bars represent mean ± SEM; n = 4 cell lysates. **p < 0.01, two-tailed Student’s t test.
(J) Normalized transferrin uptake at 30 min in low-tetracycline-induced PAC WT-, Y10A-, and L13A-overexpressing stable cells. Control (as 100%) is the parental T-REx HEK293 cell line. Flow cytometry analysis of ~10,000 cells for each biological replicate n (mean ± SEM; n = 4–8) ***p < 0.0001, one-way ANOVA with Bonferroni post hoc test. ns, not significant.
See also Figure S2.