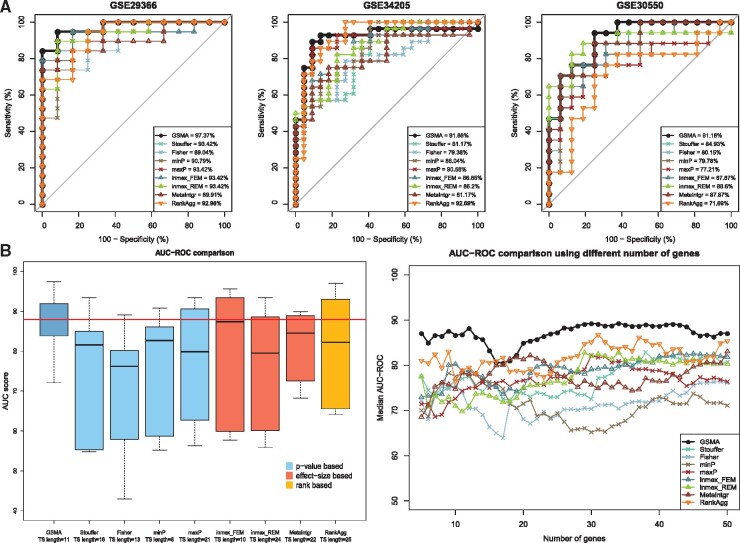
Fig. 4.
A comparison between the proposed meta-analysis framework—GSMA and the eight other existing meta-analysis approaches—Stouffer’s method, Fisher’s method, minP, maxP, inmex_FEM, inmex_REM, MetaIntegrator and RankAggreg, using influenza disease datasets. Panel A shows the AUC plots across three (out of six) independent validation datasets based on the test signature identified by each framework. In two out of these three datasets, GSMA achieved higher AUC-ROC score compared to other approaches. The left plot in panel B shows the comparison of the AUC-ROC scores across all six validation datasets. The median AUC-ROC score obtained by GSMA is significantly higher (P-value = 0.032) than all other median AUC-ROC scores obtained by the other P-value based approaches. Finally, the right plot in panel B shows that, regardless of the length of the test signature, GSMA achieved higher average AUC-ROC scores compared to the others approaches in most of the cases

