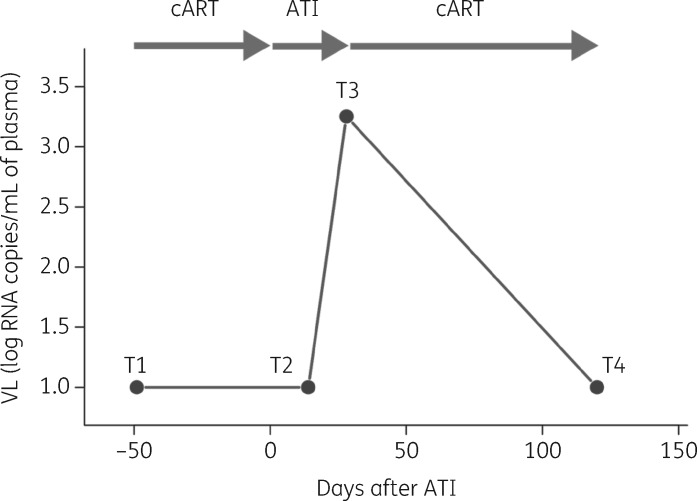
Figure 1.
Schematic overview of the study set-up. PBMCs were collected at four different timepoints (T1, T2, T3 and T4). CSF was collected at two timepoints (T1 and T3). T1 represents the sampling under cART (baseline; undetectable VL). ATI occurs at Day 0. T2 represents 7–15 days after ATI (undetectable VL). At T3, viral rebound occurs (detectable VL). T4 represents a timepoint after cART restart (approximately 3 months; undetectable VL).

