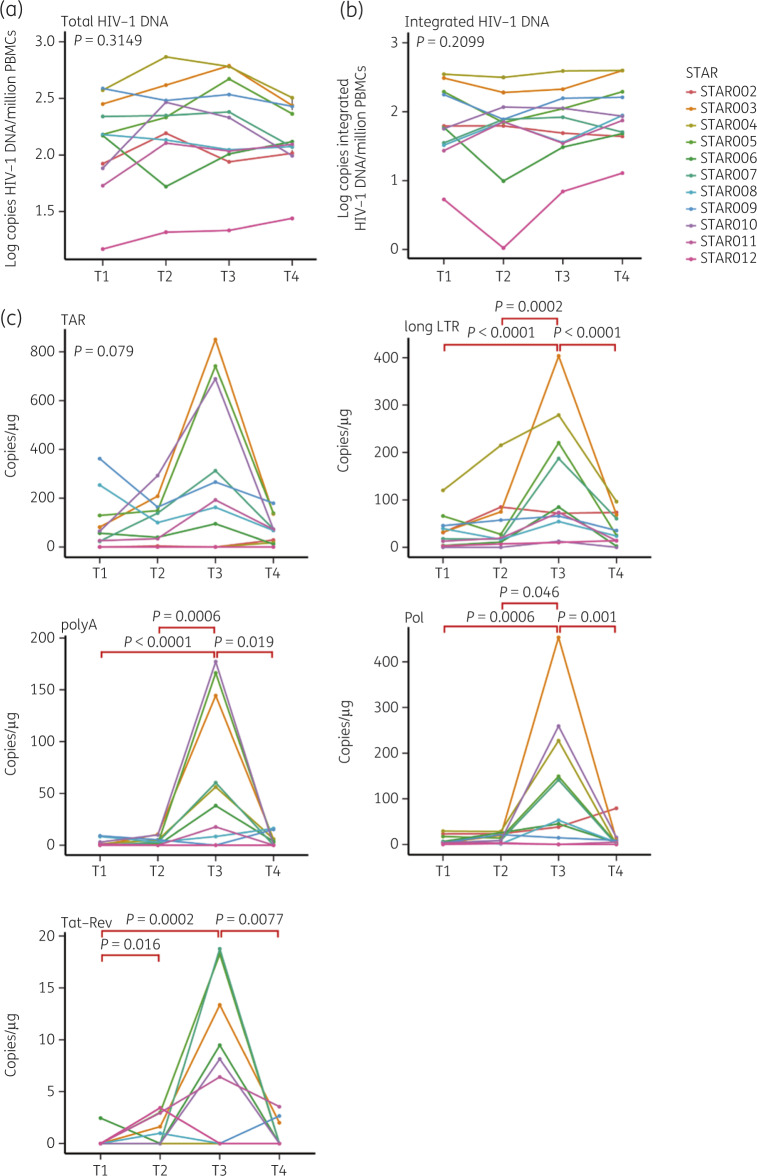
Figure 2.
Viral reservoir size quantification at the four different timepoints during ATI. Levels of total HIV-1 DNA (a) and integrated HIV-1 DNA (b) at T1, T2, T3 and T4. Levels for the different transcripts (TAR, long LTR, polyA, Pol and Tat-Rev) of CA HIV-1 RNA (c) at T1, T2, T3 and T4. Friedman statistical analysis with post hoc Dunn test was performed. Significant P values are indicated in red. This figure appears in colour in the online version of JAC and in black and white in the print version of JAC.

