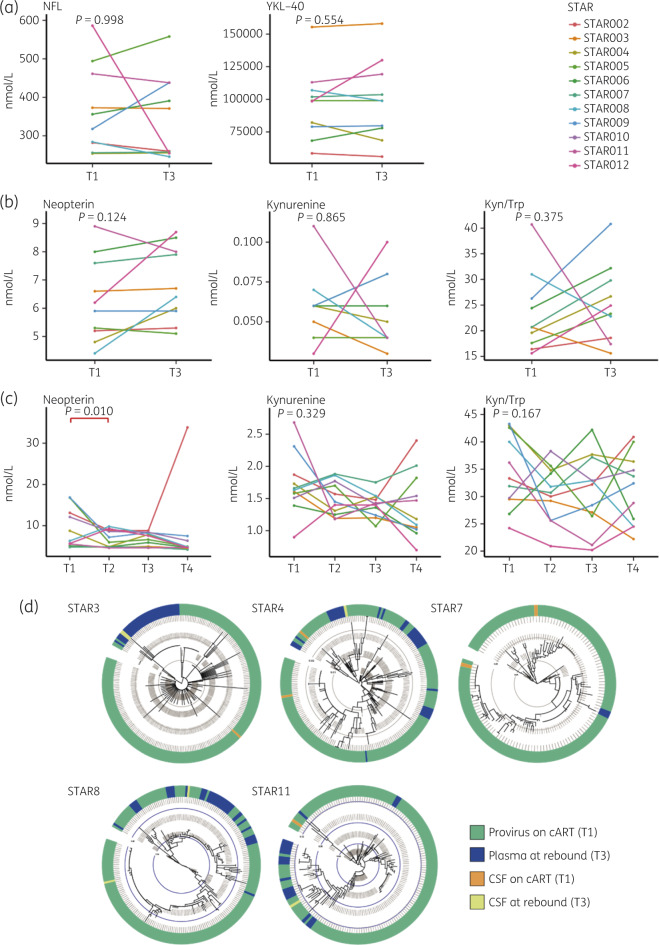
Figure 3.
Inflammation marker levels in CSF and plasma during ATI. (a) Levels of NFL and YKL-40 in CSF at T1 and T3. (b) Levels of immune activation markers neopterin, kynurenine and kynurenine/tryptophan in CSF at T1 and T3. (c) Levels of neopterin, kynurenine and kynurenine/tryptophan in plasma at T1, T2, T3 and T4. Statistical Wilcoxon signed rank (a and b) and Friedman test with post hoc Dunn analysis (c) were performed. Significant P values are indicated in red. Kyn/Trp, kynurenine/tryptophan. (d) Maximum-likelihood phylogenetic trees representing CSF and plasma sequences at T1 and T3 for five participants from whom we obtained CSF sequences. The coloured strip represents sampling origin for each sequence as indicated by the legend. The trees are drawn to scale and the grey circles represent the branch length from the root expressed as the number of substitutions per site. This figure appears in colour in the online version of JAC and in black and white in the print version of JAC.

